
Screen guide · Web app
Students by class and section
A head count for every class and section: how many students, how many are new and old, and how many are male and female.
यह पेज अंग्रेज़ी में है। कुछ समझ न आए तो ।
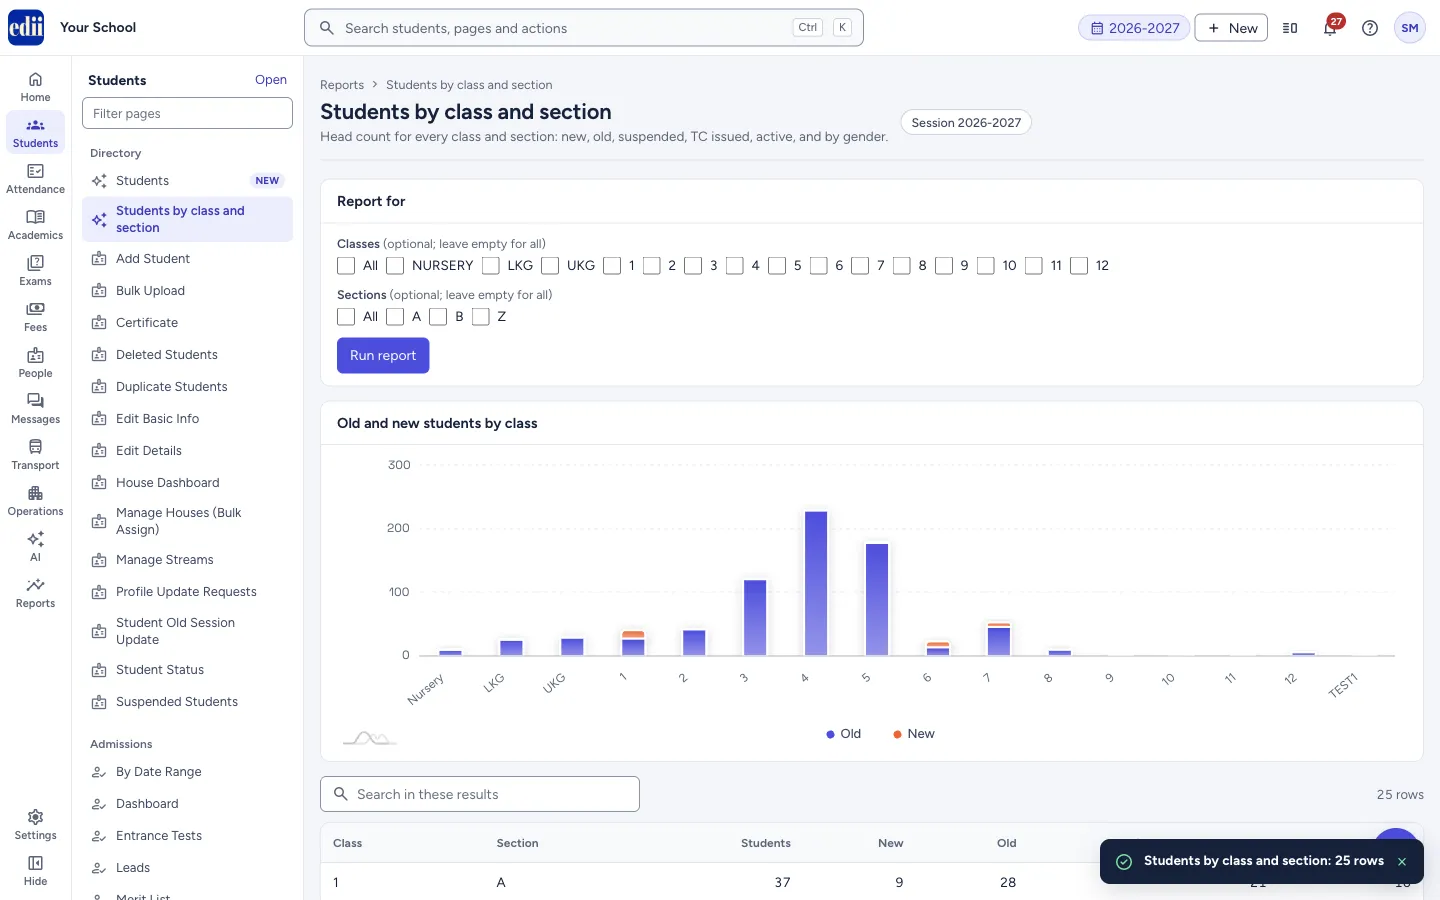
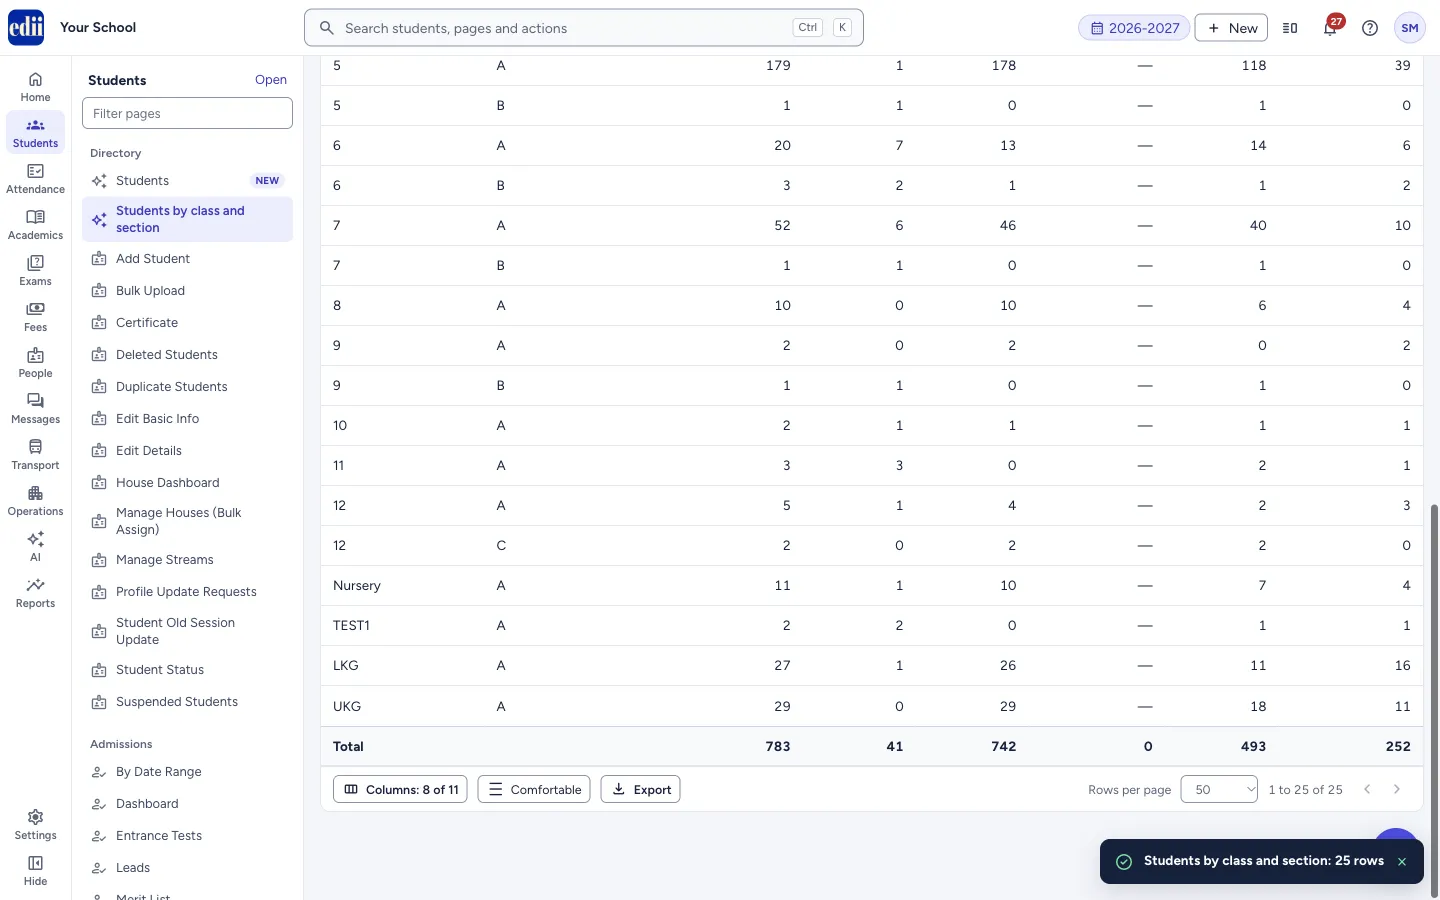
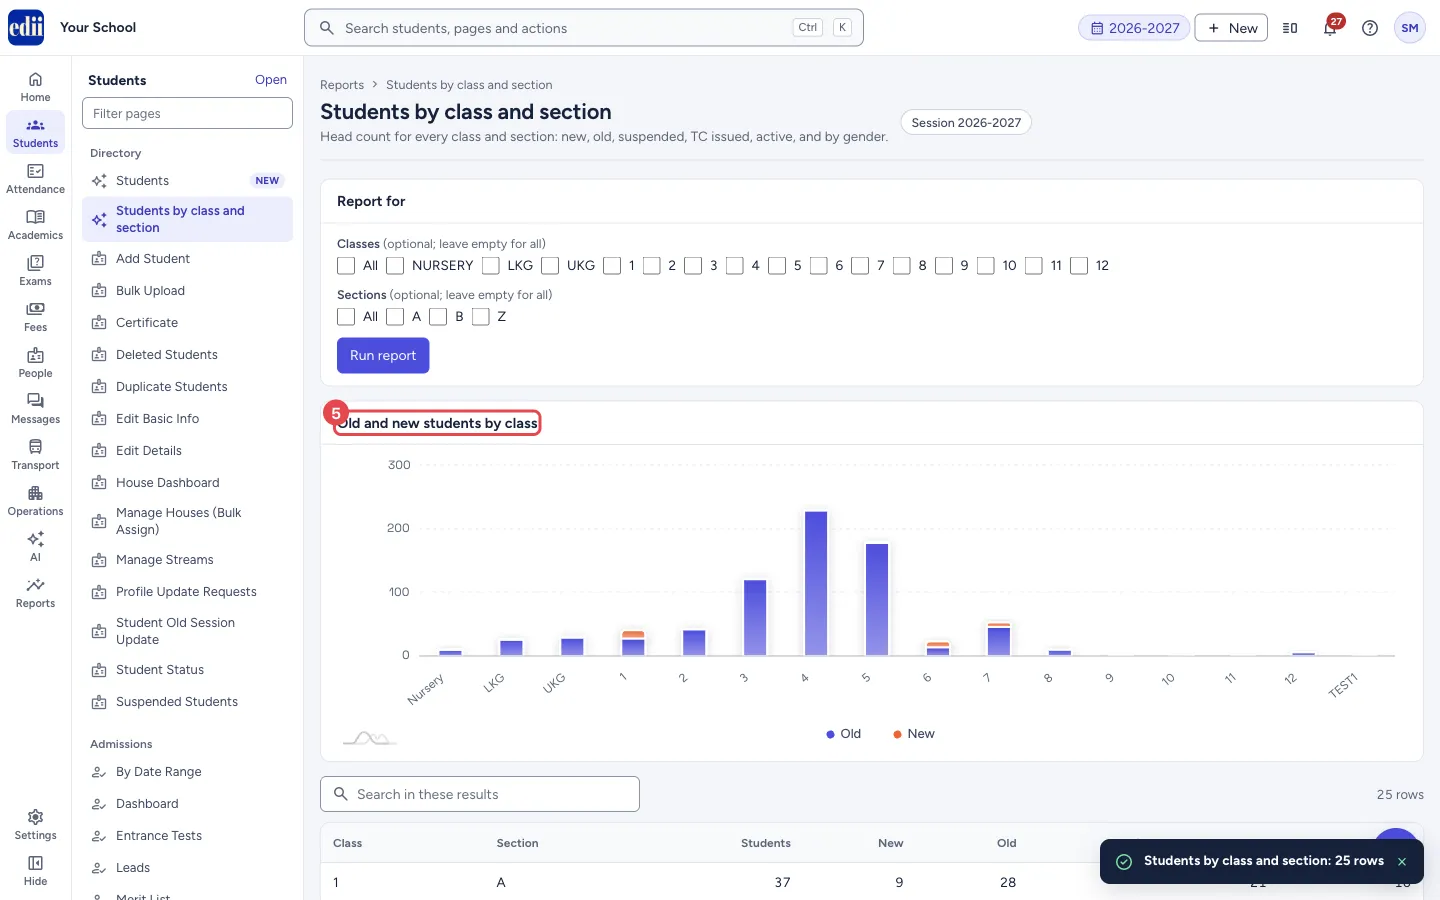
Students by class and section shows one row for each class and section of the selected session, with a Total row at the bottom. A bar chart, Old and new students by class, sits above the table.
The report runs by itself as soon as you open it, so you see all classes and sections at once. Use the Classes and Sections tick boxes to look at only some of them. The table and chart change at once; you do not need to run the report again.
Who uses it and when
Section titled “Who uses it and when”The principal and the office use it to report the school’s strength, or to check how many students a section has before fixing teachers, rooms or fees.
Before you start
Section titled “Before you start”- Nothing to set up. The figures come from the students added in the selected session (shown next to the title).
Where to find it
Section titled “Where to find it”- In school.edii.in: Students › Directory › Students by class and section
- Or press Ctrl K (⌘ K on a Mac) and type Students by class and section.
- Address:
school.edii.in/reports/students-by-class - Who can see it: Staff whose role includes Students or Attendance or Reports access. Shown only when your school uses Student and Report in EDII. If it is missing from your menu, ask your school admin.
 Open a bigger pictureतस्वीर बड़ी करें
Step by step
Section titled “Step by step”1. Open the report
Section titled “1. Open the report”Open Students › Directory › Students by class and section. The message Students by class and section: <n> rows appears when the figures have loaded.
 Open a bigger pictureतस्वीर बड़ी करें
2. Choose classes (optional)
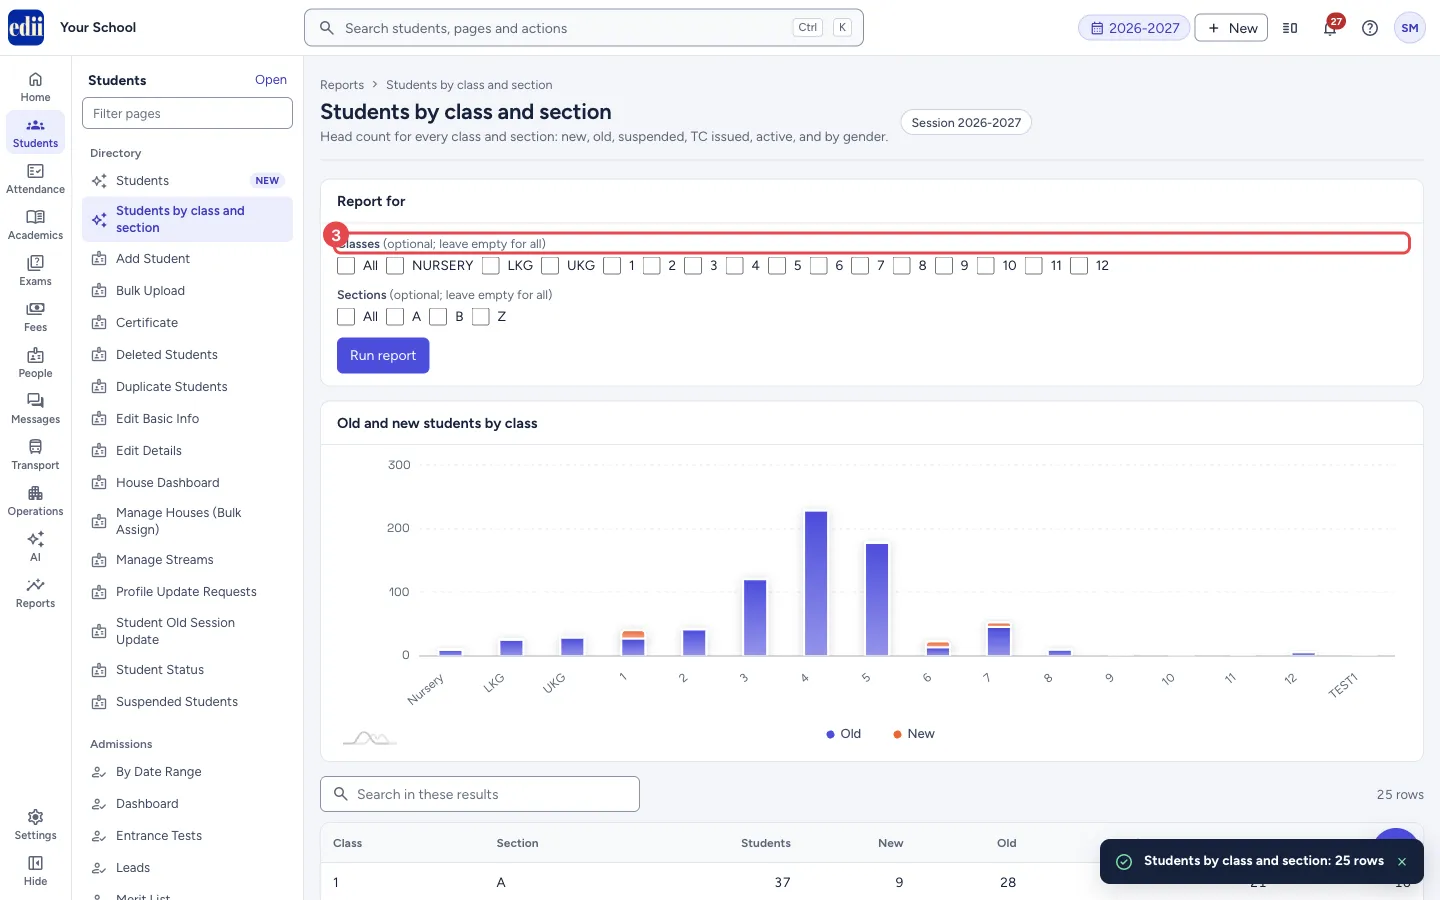
Section titled “2. Choose classes (optional)”Under Classes (optional; leave empty for all) tick one or more classes, or tick All. Leave all boxes empty to see every class.
 Open a bigger pictureतस्वीर बड़ी करें
3. Choose sections (optional)
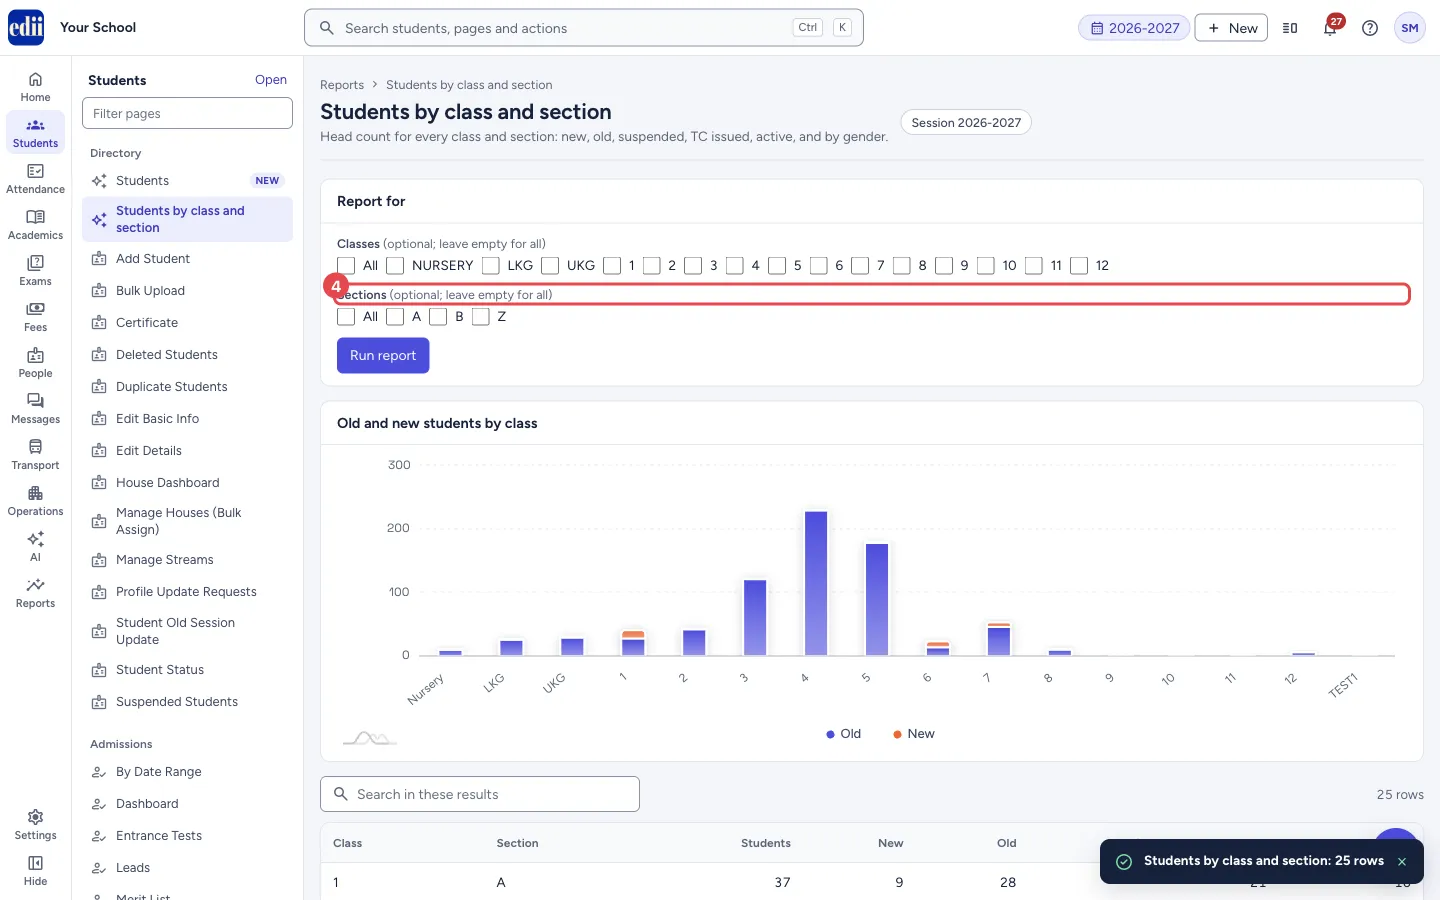
Section titled “3. Choose sections (optional)”Under Sections (optional; leave empty for all) tick the sections you want. Choosing sections and classes together shows only rows that match both.
 Open a bigger pictureतस्वीर बड़ी करें
4. Read the chart
Section titled “4. Read the chart”Old and new students by class shows one bar for each class, split into Old and New.
 Open a bigger pictureतस्वीर बड़ी करें
5. Search, sort and download
Section titled “5. Search, sort and download”Type in Search in these results to find a class or section. Use Export under the table for CSV or Excel (every row), or Print this page. Use Columns to show or hide Suspended, TC issued and Gender not set.
Fields and filters
Section titled “Fields and filters”| Field | What it is | Notes |
|---|---|---|
| Classes | Shows only the classes you tick. | Optional. Empty means all classes. |
| Sections | Shows only the sections you tick. | Optional. Empty means all sections. |
| Search in these results | Finds rows in the table by any text in it. | Several words must all match. |
Buttons
Section titled “Buttons”| Button | What it does | What happens next |
|---|---|---|
| Run report | Gets the figures again from the school’s records. | The table, totals and chart are rebuilt. Use it after you add or change students. |
| Columns | Chooses which columns to show. Reset to default columns brings back the first set. | The table changes. Your choice is remembered on this computer. |
| Comfortable / Compact | Changes the height of the rows. | Rows become taller or tighter. |
| Export | CSV or Excel (all rows) or Print this page. | A file downloads or the print window opens. The printout carries the school name, the session and the time the report was made. |
Columns
Section titled “Columns”| Column | Meaning |
|---|---|
| Class | The class. |
| Section | The section. |
| Students | Number of students in that class and section. |
| New | How many of them are new. |
| Old | How many of them are old. |
| Active | Active students in that class and section. |
| Suspended | Suspended students. Hidden at first; show it from Columns. |
| TC issued | Students who have been given a transfer certificate. Hidden at first. |
| Male | Number of male students. |
| Female | Number of female students. |
| Gender not set | Students whose gender is not filled in. Hidden at first. |
After you save
Section titled “After you save”- This report only reads data. Nothing is saved or sent.
Good to know
Section titled “Good to know”- The Total row adds up the rows that are showing, so after you tick some classes or sections it shows the total of those only.
Messages you may see
Section titled “Messages you may see”| Message | What it means | What to do |
|---|---|---|
| Nothing to report for these choices | No row matches. | Try other months, classes or sections. |
| The connection failed before the report finished. Check the internet connection and try again. | The figures could not be loaded. | Check the internet and select Run report. |
| The report did not run. | The school’s records did not return the figures. | Select Run report again. |
| Your login cannot open this report. Ask your school administrator for access. | Your login does not have access to student or report pages. | Ask your school administrator. |
- Download the Excel file when you want to add up or sort the figures yourself.
Stuck? Try this
Section titled “Stuck? Try this”| Problem | Likely cause | What to do |
|---|---|---|
| The class I ticked shows no rows | That class and section combination has no students in this session. | Untick it, or check the session shown next to the title. |
Did this page help?क्या इस पेज से मदद मिली?
Thanks! Glad it helped.धन्यवाद! अच्छा लगा कि काम बन गया।
Sorry about that. Ask in your own words, or write to us.माफ़ कीजिए। अपने शब्दों में पूछें, या हमें लिखें।