
Screen guide · Web app
Teacher Performance AI
Runs an AI analysis on tests already taken and shows reports on how classes did, compares teachers, classes, sections, subjects or exam types, and gives a written insight.
यह पेज अंग्रेज़ी में है। कुछ समझ न आए तो ।
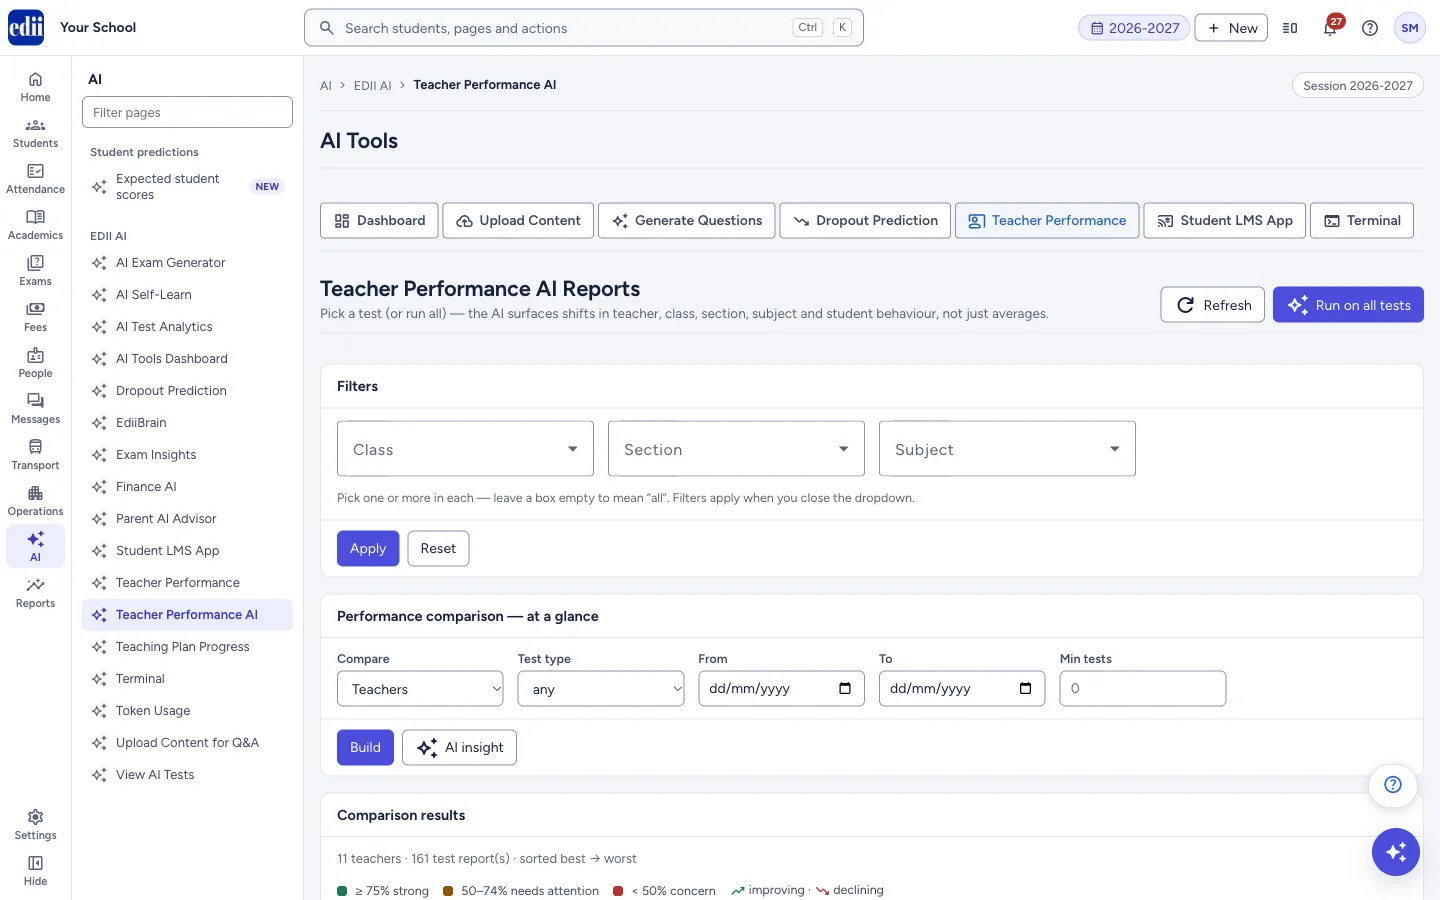
Teacher Performance AI (headed Teacher Performance AI Reports) is part of AI Tools. It takes the school’s tests and marks and produces a report for each test: average, pass rate, median, trend, score distribution, top and bottom students, students who climbed or slipped, history for the same class and subject, and a comparison with other sections. A written AI narrative explains the numbers in words.
The page has four working parts. Filters (class, section, subject) narrow every list. Performance comparison — at a glance ranks teachers, classes, class-sections, subjects or exam types. Tests lists the tests you can analyse. All reports and Run history show what has already been analysed. A report opens on the right.
The reports are made by AI from marks already entered. They describe how students scored. Many things other than teaching affect a score, so staff should read them with care and not use them alone to judge a teacher.
Who uses it and when
Section titled “Who uses it and when”The principal and academic coordinators use it after exams, to compare classes and subjects and to see which tests need a closer look.
Before you start
Section titled “Before you start”- Tests must exist with marks entered. A test with no marks has nothing to analyse.
- To compare teachers, teachers must be set on the timetable. Without that, the comparison switches to subjects and says This school has no teacher–timetable mapping yet, so the comparison is shown by subject. Set up the timetable to compare teachers directly.
Where to find it
Section titled “Where to find it”- In school.edii.in: AI › EDII AI › Teacher Performance AI
- Or press Ctrl K (⌘ K on a Mac) and type Teacher Performance AI.
- Address:
school.edii.in/ai-tools/teacher-performance - Who can see it: Shown only when your school uses EDII’s AI in EDII. If it is missing from your menu, ask your school admin.
 Open a bigger pictureतस्वीर बड़ी करें
Step by step
Section titled “Step by step”1. Narrow the filters
Section titled “1. Narrow the filters”In Filters, open Class, Section and Subject and tick one or more in each. Leave a box empty to mean all. The choices apply when you close the list. Select Apply to reload, or Reset to clear the filters.
2. Analyse tests
Section titled “2. Analyse tests”In the Tests box, each row is a test with its subject, class and section, type and date. A test that has no report shows Analyse; one that has a report shows View and Re-run. Tick tests (or use Select all) and select Analyse selected (N) to analyse several at once. Use Search to find a test by ID, subject or type.
Run on all tests at the top analyses every test of the school. It runs in the background and shows a bar N / M tests analysed; Hide only stops you watching it. Tests already analysed recently are skipped. If everything is done you see Nothing to do — all tests already analysed.
3. Build a comparison
Section titled “3. Build a comparison”Under Performance comparison — at a glance, choose what to Compare: Teachers, Classes, Class-sections, Subjects or Exam types. You can narrow by Test type, a From and To date and Min tests. Select Build.
Comparison results lists each group best to worst with a bar for the average percentage, the pass rate and a trend arrow. Green is 75% and above (strong), amber 50% to 74% (needs attention) and red below 50% (concern). A group marked shared · not ranked is a subject taught by more than one teacher, so it is not ranked. Show the numbers in a table gives the details.
Select AI insight for a short written reading of the comparison. It shows under AI insight; if none can be written you see No AI insight available.
4. Open a report
Section titled “4. Open a report”Select View on a test, or a card under All reports. The report opens on the right with the figures, the AI narrative, Behaviour signals, Data quality notes, Score distribution, Top students, Bottom students, Climbing, Slipping, History and Section comparison. Close shuts it.
A card marked no AI write-up yet was saved without the written part. It is done again the next time the test is analysed.
5. Check the run history
Section titled “5. Check the run history”Run history lists the last batch runs with a status, how many tests were processed, skipped or failed, and a progress bar. Select one to see its detail, including any problems grouped by reason.
Fields and filters
Section titled “Fields and filters”| Field | What it is | Notes |
|---|---|---|
| Class, Section, Subject | Filters for the tests, reports and comparison. | Several can be ticked in each. Empty means all. |
| Compare | What the comparison groups by. | Teachers, Classes, Class-sections, Subjects or Exam types. |
| Test type | Limits the comparison to one type of test. | Starts at any. |
| From, To | Limits the comparison to a date range. | Optional. |
| Min tests | Hides groups with fewer tests than this number. | Starts at 0. |
| Search | Finds a test in the Tests box. | By test ID, subject or type. |
| Reports per page | How many saved reports show on a page. | A list of page sizes. |
Buttons
Section titled “Buttons”| Button | What it does | What happens next |
|---|---|---|
| Refresh | Loads the tests and reports again. | The lists update. |
| Run on all tests | Analyses every test of the school in the background. | Queued N test(s). M already analysed. and a progress bar. |
| Apply / Reset | Applies or clears the class, section and subject filters. | The lists reload. |
| Build | Builds the comparison. | Results show under Comparison results. |
| AI insight | Asks for a written reading of the comparison. | The text shows under AI insight. |
| Select all / Clear | Ticks or unticks every test in the list. | The count on Analyse selected changes. |
| Analyse selected (N) | Analyses the ticked tests. | Report ready, or a batch is queued if 10 or more are ticked. |
| Analyse / Re-run / View | Analyses one test, analyses it again, or opens its report. | The report opens on the right. |
Columns
Section titled “Columns”| Column | Meaning |
|---|---|
| Avg % | Average percentage of the group or test. |
| Pass | Share of students who passed. |
| Trend | Whether results improved or declined from the oldest test to the newest. |
| High / Low | Students at 75% and above, and students below 33%, totalled across the group’s tests. |
Good to know
Section titled “Good to know”- Reports and insights are AI-written from the marks. Staff should check them.
- A subject taught by more than one teacher, or with no teacher on the timetable, is shown but not ranked.
- Ticking 10 or more tests, or using Run on all tests, runs the analysis in the background.
Messages you may see
Section titled “Messages you may see”| Message | What it means | What to do |
|---|---|---|
| Pick at least one test | Analyse selected was used with nothing ticked. | Tick one or more tests. |
| Report ready | The analysis of one test is complete. | Read the report. |
| Generated N/M reports | Several tests were analysed. | Open the reports you need. |
| Nothing to do — all tests already analysed | Every test has a recent report. | Nothing to do. |
| Failed to queue batch | The background run did not start. | Try again. |
| Analysis failed | A test could not be analysed. | Try again later. |
| No report saved for this test yet | The test has no report. | Select Analyse. |
| Could not build comparison | The comparison could not be built. | Change the filters and select Build. |
| No analysed reports yet for these filters. Run a few tests (or “Run on all tests”), then come back. | There are no reports to compare. | Analyse some tests first. |
| Could not generate AI insight | The written reading could not be made. | Try again. |
- Start with Run on all tests after an exam, then use Build to compare.
- Use Min tests to leave out groups with only one or two tests.
Stuck? Try this
Section titled “Stuck? Try this”| Problem | Likely cause | What to do |
|---|---|---|
| The teacher comparison shows only one group, “(Unassigned)”. | The timetable does not say which teacher teaches each subject. | Set up the timetable. The comparison shows subjects meanwhile. |
Did this page help?क्या इस पेज से मदद मिली?
Thanks! Glad it helped.धन्यवाद! अच्छा लगा कि काम बन गया।
Sorry about that. Ask in your own words, or write to us.माफ़ कीजिए। अपने शब्दों में पूछें, या हमें लिखें।