
Screen guide · Web app
Performance
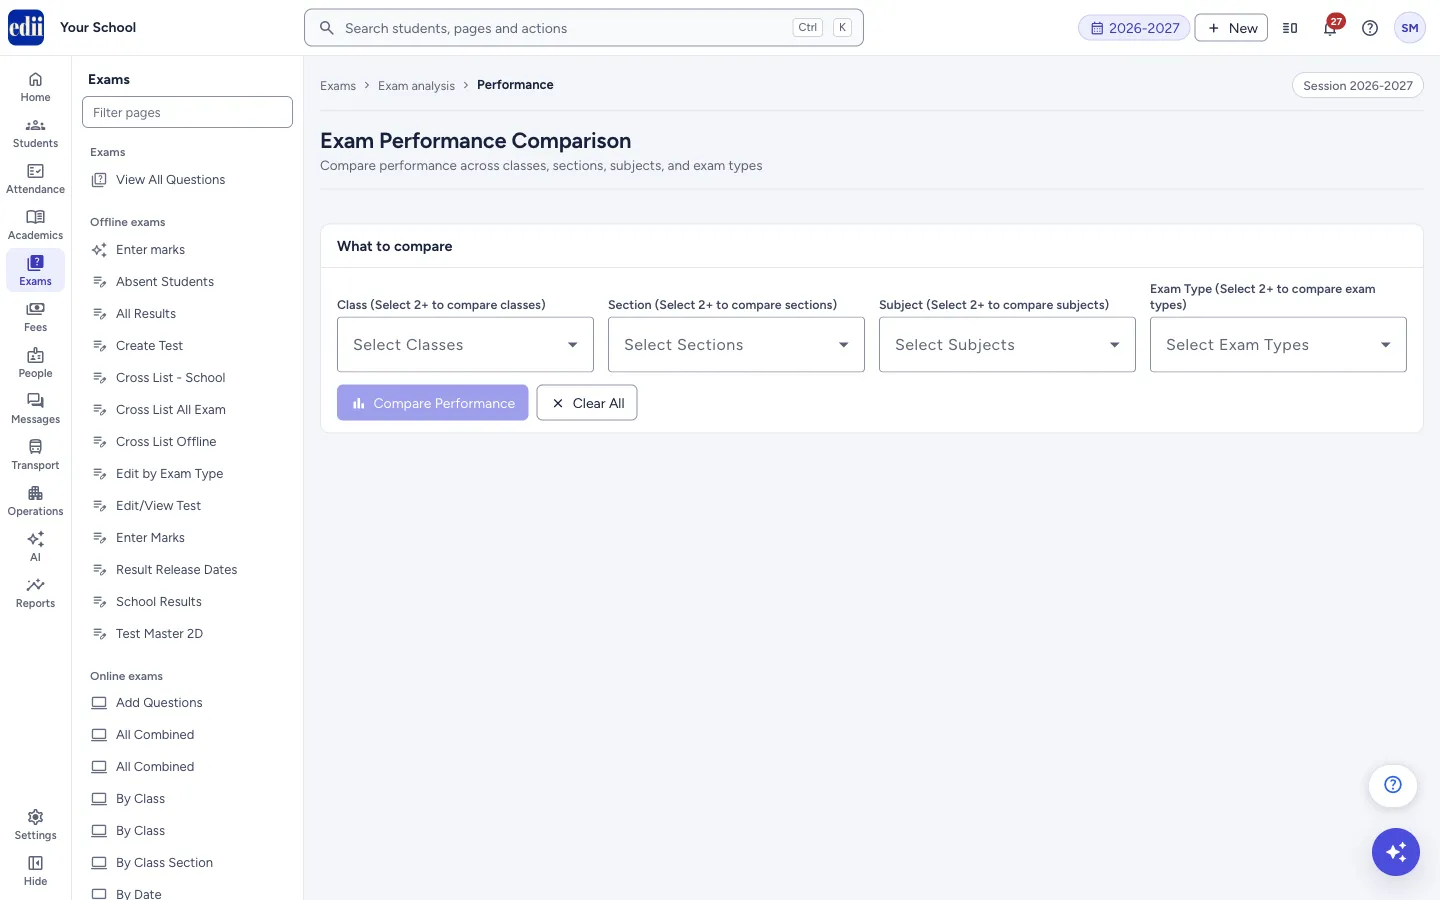
Compares the marks of two or more classes, sections, subjects or exam types, with a summary, a table you can open down to each student, and charts.
यह पेज अंग्रेज़ी में है। कुछ समझ न आए तो ।
The screen is headed Exam Performance Comparison. In What to compare you tick the Class, Section, Subject and Exam Type you are interested in. To compare, you must tick at least two items in at least one of the four lists, for example two classes, or two exam types. The other lists can hold one item or none and narrow the comparison.
Select Compare Performance. EDII shows four summary boxes, a table with one row for each item you compared, and charts. Each row can be opened to list the students behind it.
Who uses it and when
Section titled “Who uses it and when”The principal, exam in-charge or teachers, to see how classes, sections, subjects or exams compare.
Before you start
Section titled “Before you start”- Marks must have been entered for the exams you want to compare.
Where to find it
Section titled “Where to find it”- In school.edii.in: Exams › Exam analysis › Performance
- Or press Ctrl K (⌘ K on a Mac) and type Performance.
- Address:
school.edii.in/view/exam-performance - Who can see it: Staff whose role includes Exams access. Shown only when your school uses Exam and EDII’s AI in EDII. If it is missing from your menu, ask your school admin.
 Open a bigger pictureतस्वीर बड़ी करें
Step by step
Section titled “Step by step”1. Choose the classes
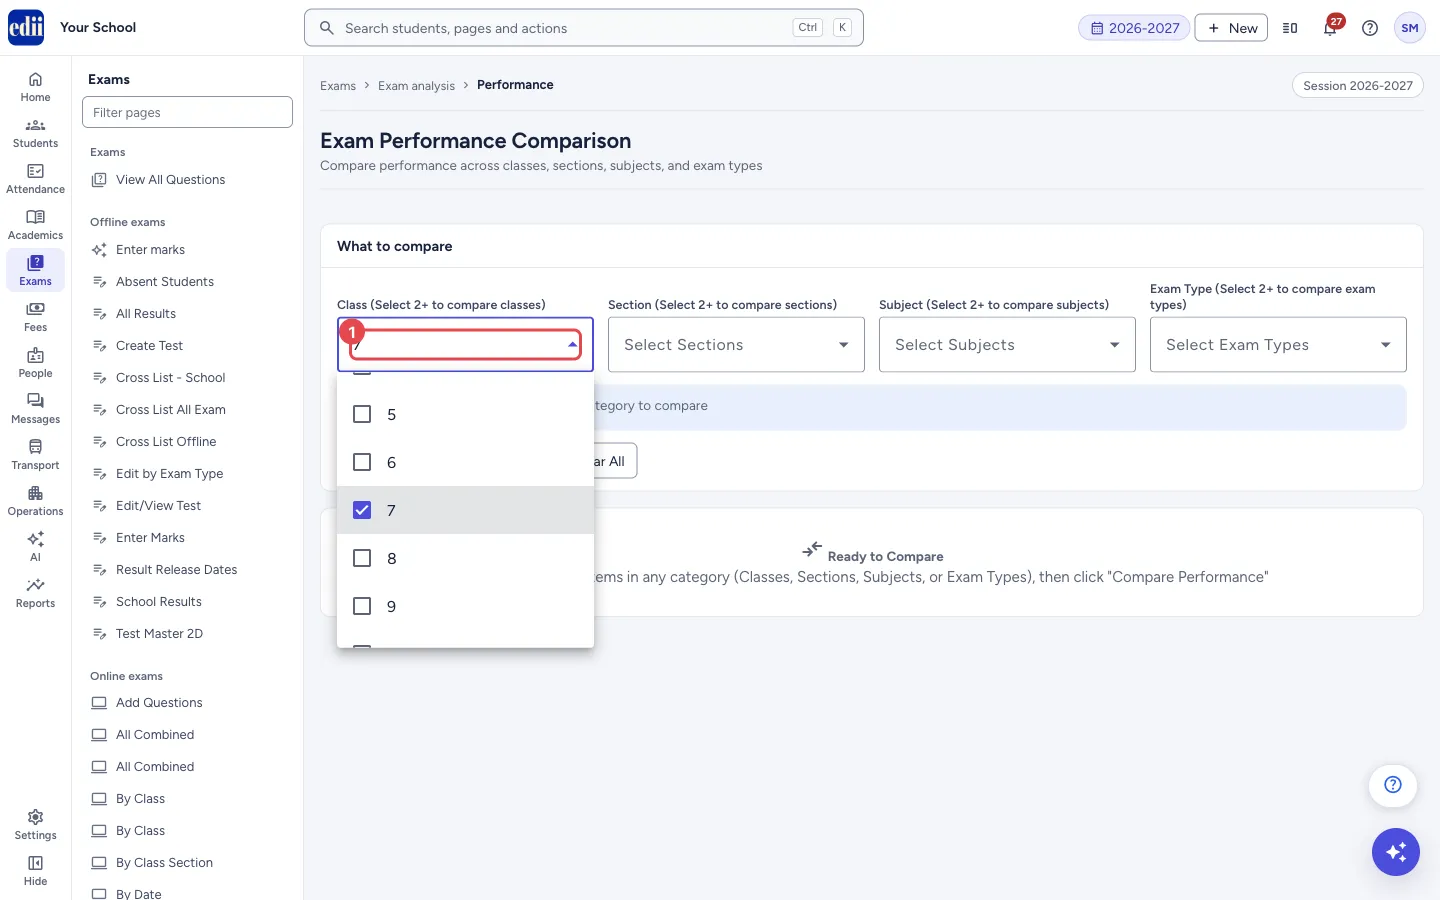
Section titled “1. Choose the classes”In Class (Select 2+ to compare classes), tick one or more classes, or Select All. Choosing classes fills the Subject list with their subjects.
 Open a bigger pictureतस्वीर बड़ी करें
2. Choose sections, subjects and exam types
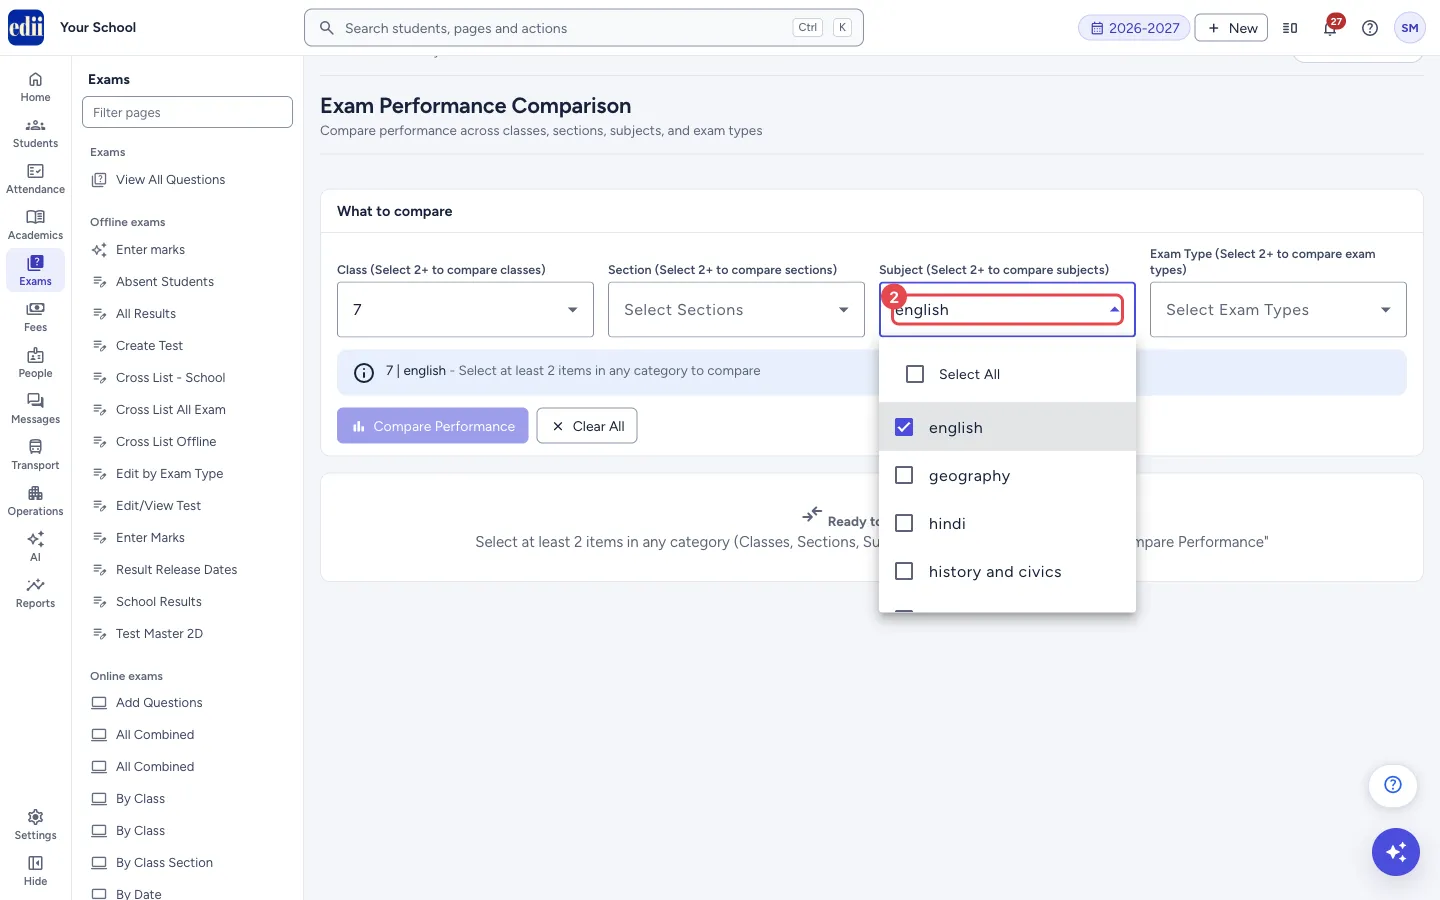
Section titled “2. Choose sections, subjects and exam types”Tick the Section, Subject and Exam Type items you want. Each list has Select All. A blue line under the lists describes what will be compared, for example 7 | english, and says Select at least 2 items in any category to compare until you have two or more in one list.
 Open a bigger pictureतस्वीर बड़ी करें
3. Compare
Section titled “3. Compare”Select Compare Performance. It stays switched off until at least two items are chosen in one list. While EDII works it says Analyzing performance data…. Clear All empties all four lists.
4. Read the summary
Section titled “4. Read the summary”Best Performer is the row with the highest average. Highest Average is that average. Overall Average Marks is the average of the row averages. Total Marks Entries is the number of marks entries behind all the rows.
5. Read the table
Section titled “5. Read the table”The table is titled Performance Comparison: followed by what you compared. Each row has its Category, Marks Entries, Average, Highest, Lowest and a Performance group of four numbers: how many entries were Excellent (80% and above), Good (60-79%), Average (40-59%) and Needs Work (below 40%). The best row has a cup.
6. Open the students of a row
Section titled “6. Open the students of a row”Select the arrow at the start of a row to open Student details for it. The list shows SR-ID, roll number, name, class and section, subject, exam type, marks, percentage and band. Use Search name / ID / Roll and the band box (All performance bands, Excellent, Good, Average, Needs Work, or Absent / Medical Leave) to narrow it.
7. Look at the charts
Section titled “7. Look at the charts”Performance Comparison shows the average, highest and lowest of each row. Overall Performance Distribution shows how all the entries split into the four bands. When you compare three or more rows, Multi-Metric Comparison also appears.
Fields and filters
Section titled “Fields and filters”| Field | What it is | Notes |
|---|---|---|
| Class (Select 2+ to compare classes) | The classes to include. | Optional. Tick two or more to compare classes. |
| Section (Select 2+ to compare sections) | The sections to include. | Optional. Tick two or more to compare sections. |
| Subject (Select 2+ to compare subjects) | The subjects to include. | Optional. The list depends on the classes chosen. |
| Exam Type (Select 2+ to compare exam types) | The exam types to include. | Optional. Tick two or more to compare exam types. |
| Search name / ID / Roll | Finds a student in an opened row. | Works on the students of that row only. |
Buttons
Section titled “Buttons”| Button | What it does | What happens next |
|---|---|---|
| Compare Performance | Builds the comparison. | The summary, table and charts appear. |
| Clear All | Empties all four lists. | The comparison is cleared. |
Columns
Section titled “Columns”| Column | Meaning |
|---|---|
| Category | The class, section, subject or exam type of the row. |
| Marks Entries | The number of marks entries in that row. |
| Average, Highest, Lowest | The average, highest and lowest marks in the row. |
| Performance | Four numbers: entries that are Excellent (80% and above), Good (60-79%), Average (40-59%) and Needs Work (below 40%). |
| Marks (student details) | The marks as obtained / total. A student marked absent shows AB and one on medical leave shows ML, with a dash for the percentage; they are not treated as zero. |
Good to know
Section titled “Good to know”- At least two items in at least one of the four lists are needed. Otherwise the message Please select at least 2 items in any category (Class, Section, Subject, or Exam Type) to compare shows.
- The bands use the percentage of each entry: Excellent 80% and above, Good 60-79%, Average 40-59%, Needs Work below 40%.
- The screen only shows data. Nothing is saved or changed.
Messages you may see
Section titled “Messages you may see”| Message | What it means | What to do |
|---|---|---|
| Please select at least 2 items in any category (Class, Section, Subject, or Exam Type) to compare | No list has two or more items ticked. | Tick at least two items in one list. |
| No Data Found | There is no exam data for the chosen lists. | Change the choice, or check that marks were entered. |
| Error fetching comparison data | The comparison could not be fetched. | Try again. |
| No students match the current filter. | The search or band you chose in an opened row matches no student. | Clear the search or choose All performance bands. |
- To compare two exams for one class, tick one class and two exam types.
- To see which students are in the Needs Work band, open the row and choose that band.
Did this page help?क्या इस पेज से मदद मिली?
Thanks! Glad it helped.धन्यवाद! अच्छा लगा कि काम बन गया।
Sorry about that. Ask in your own words, or write to us.माफ़ कीजिए। अपने शब्दों में पूछें, या हमें लिखें।