
Screen guide · Web app
Classwise Analysis
Compares the subjects of one class across the exam types you choose, with tiles, a bar chart and a table.
यह पेज अंग्रेज़ी में है। कुछ समझ न आए तो ।
The screen is headed Subject Wise Comparison of different Exam Types and is described as Analyze exam performance by subject within a class. You choose a Class and one or more exam types and select Search.
The results show, for each subject, the class’s average percentage in each exam type. If an exam type has no marks for a subject, the table shows NA.
Who uses it and when
Section titled “Who uses it and when”The principal, exam in-charge or class teacher, to see which subjects improved or fell between exams.
Before you start
Section titled “Before you start”- Marks must have been entered for the class in the exam types you choose.
Where to find it
Section titled “Where to find it”- In school.edii.in: Exams › Exam analysis › Classwise Analysis
- Or press Ctrl K (⌘ K on a Mac) and type Classwise Analysis.
- Address:
school.edii.in/view/classwise-exam-analysis - Who can see it: Staff whose role includes Exams or Reports access. Shown only when your school uses Exam and Report in EDII. If it is missing from your menu, ask your school admin.
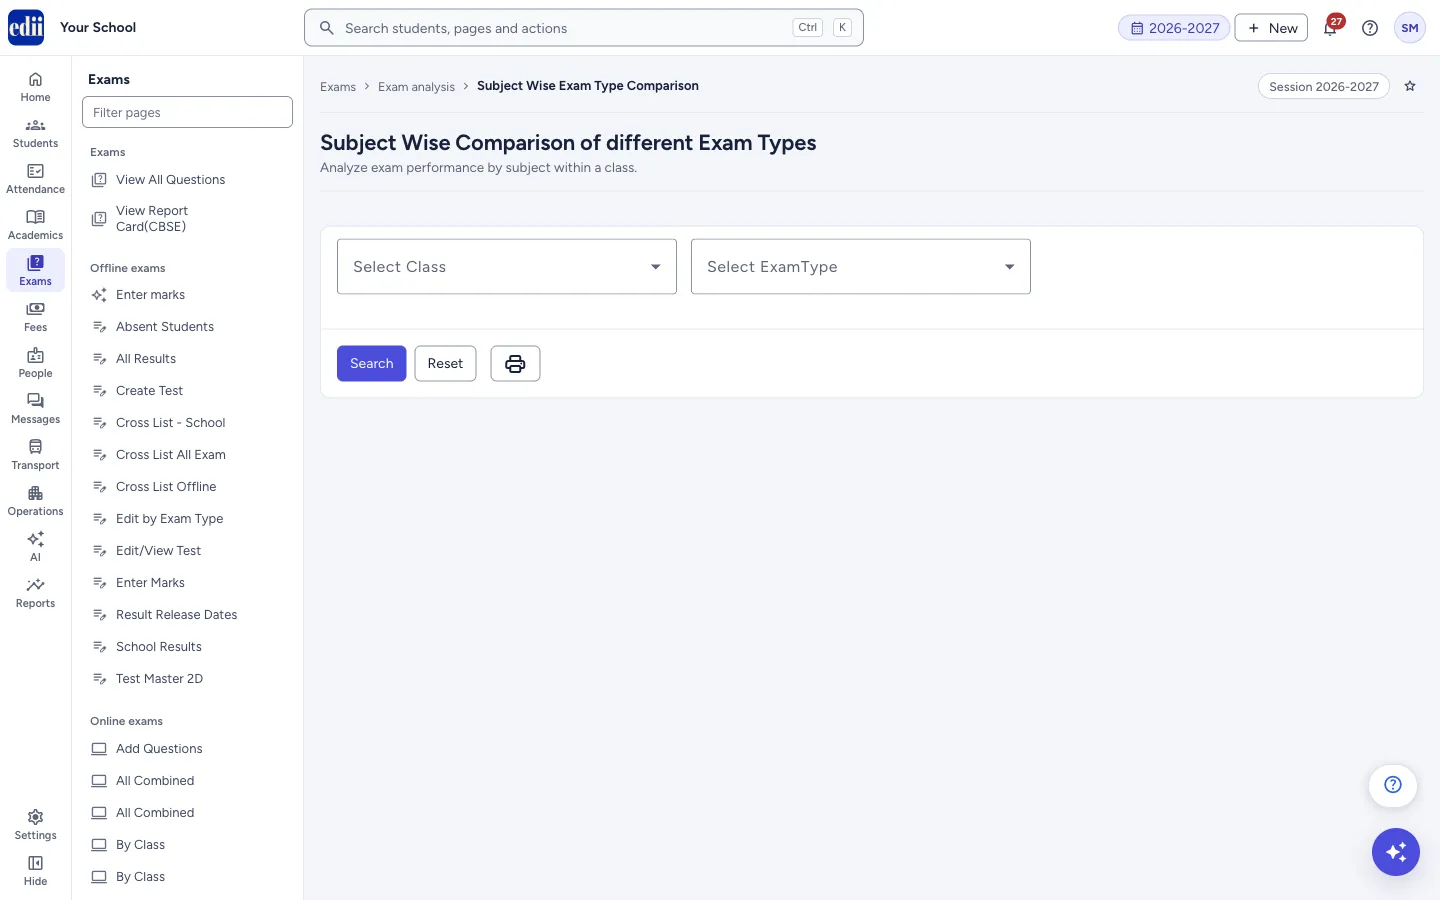 Open a bigger pictureतस्वीर बड़ी करें
Step by step
Section titled “Step by step”1. Choose the class
Section titled “1. Choose the class”In Select Class, choose the class. This is required.
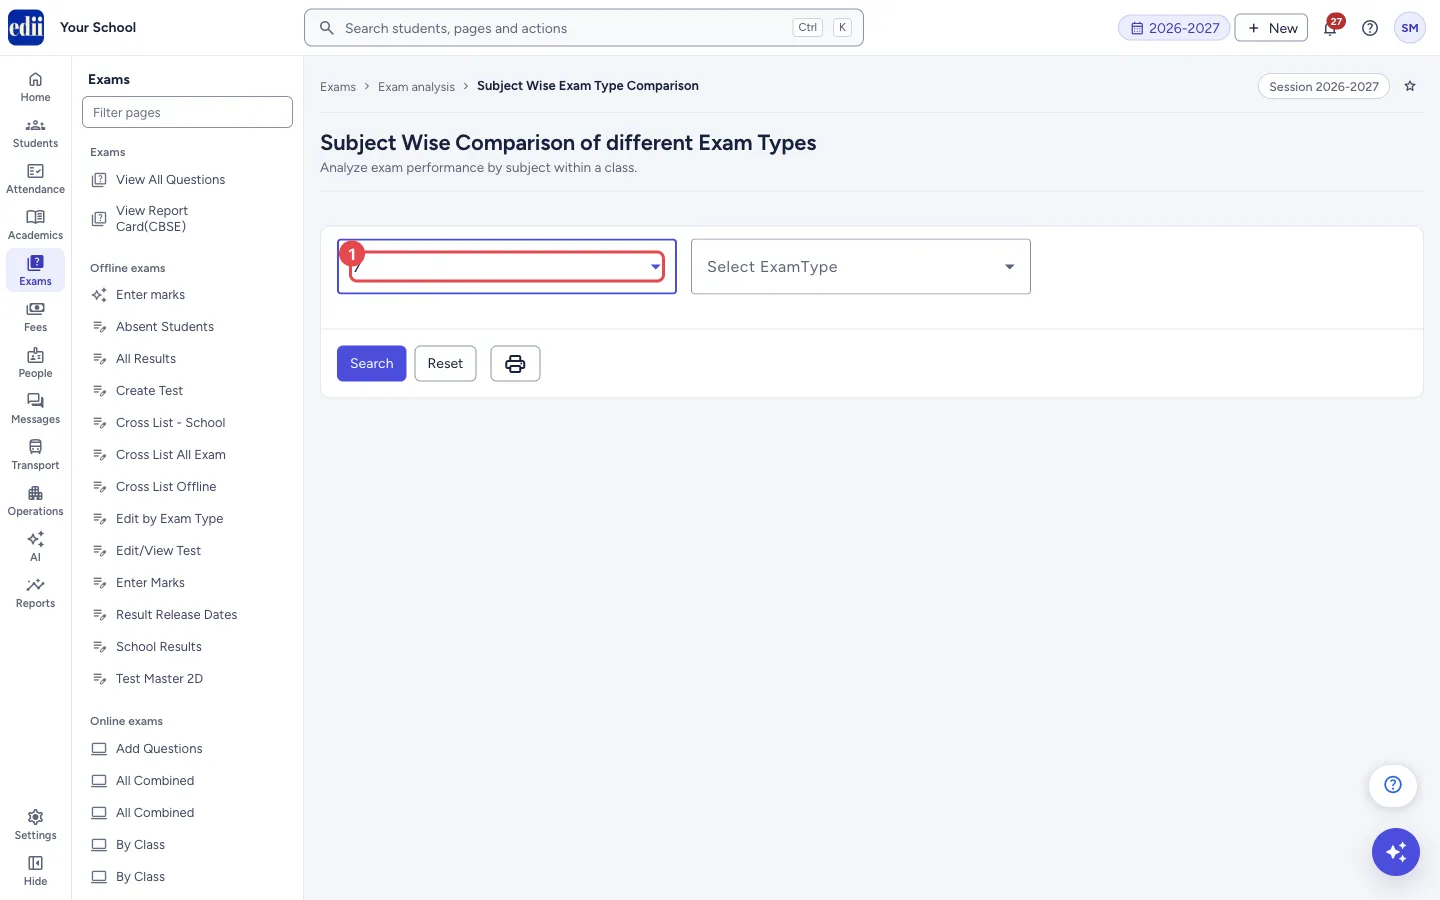 Open a bigger pictureतस्वीर बड़ी करें
2. Choose the exam types
Section titled “2. Choose the exam types”In Select ExamType, tick one or more exam types. This is required.
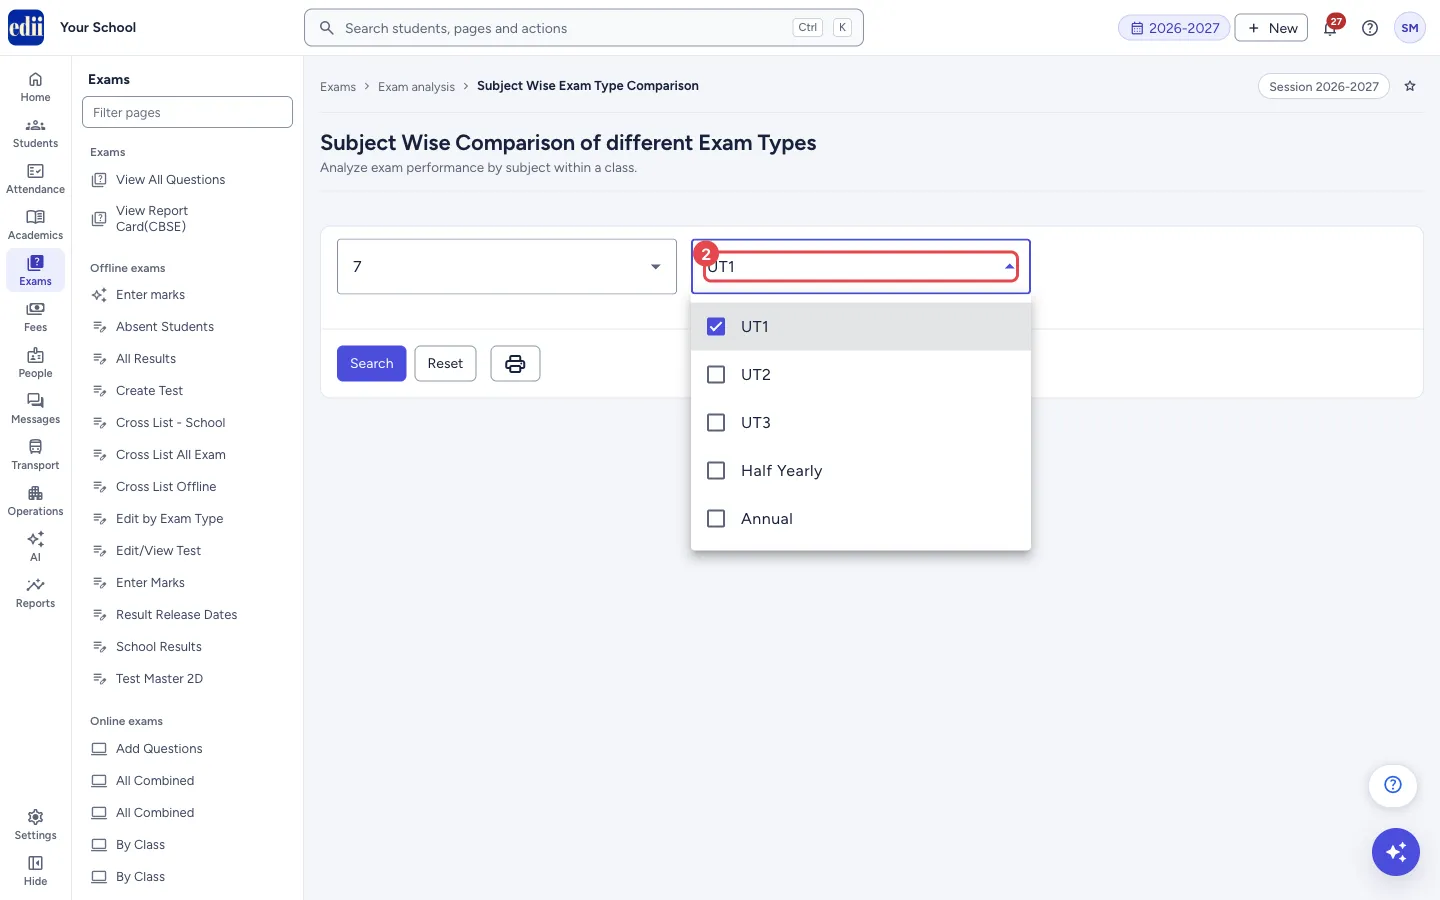 Open a bigger pictureतस्वीर बड़ी करें
3. Search
Section titled “3. Search”Select Search. The boxes close and the results appear. Select Reset to open them again.
4. Read the tiles
Section titled “4. Read the tiles”Up to four tiles, one for each of the first exam types you chose, are titled Best subject in <exam type>. A tile shows the highest subject average, the subject’s name and the lowest subject with its average (lowest … at …). A tile says No marks entered yet when there are no marks.
5. Read the chart and the table
Section titled “5. Read the chart and the table”Average % by subject for each exam type is a column chart with a group for each subject and a column for each exam type (the first eight exam types). When the class has four to eight subjects, Strong and weak subjects at a glance also shows a radar chart for up to three exam types; if you chose more, it says Shows the first 3 exam types you picked. The table below has all of them.
The table has one row for each exam type (the first column is EXAM) and one column for each subject.
6. Print
Section titled “6. Print”Select the printer button next to Reset to print the page.
Fields and filters
Section titled “Fields and filters”| Field | What it is | Notes |
|---|---|---|
| Select Class | The class to analyse. | Required. |
| Select ExamType | The exam types to compare. | Required. You can tick more than one. |
Buttons
Section titled “Buttons”| Button | What it does | What happens next |
|---|---|---|
| Search | Builds the comparison. | The tiles, charts and table appear. |
| Reset | Opens the class and exam type boxes again. | Nothing is changed in the data. |
| Print (printer icon) | Prints the results on the page. | The print window opens. |
Columns
Section titled “Columns”| Column | Meaning |
|---|---|
| EXAM | The exam type of the row. |
| One column for each subject | The class’s average percentage in that subject for that exam type. NA when no marks were entered. |
Good to know
Section titled “Good to know”- The screen only shows data. Nothing is saved or changed.
Messages you may see
Section titled “Messages you may see”| Message | What it means | What to do |
|---|---|---|
| Network Issue, Please Try Again. | The analysis could not be fetched. | Check the internet and select Search again. |
Did this page help?क्या इस पेज से मदद मिली?
Thanks! Glad it helped.धन्यवाद! अच्छा लगा कि काम बन गया।
Sorry about that. Ask in your own words, or write to us.माफ़ कीजिए। अपने शब्दों में पूछें, या हमें लिखें।