
Screen guide · Web app
Attendance Reports
Seven views of the school's student attendance (overview, class wise, student wise, monthly, below 75 percent, heatmap and reasons for absence), with filters for term, dates, class and section, and Print, Excel and PDF.
यह पेज अंग्रेज़ी में है। कुछ समझ न आए तो ।
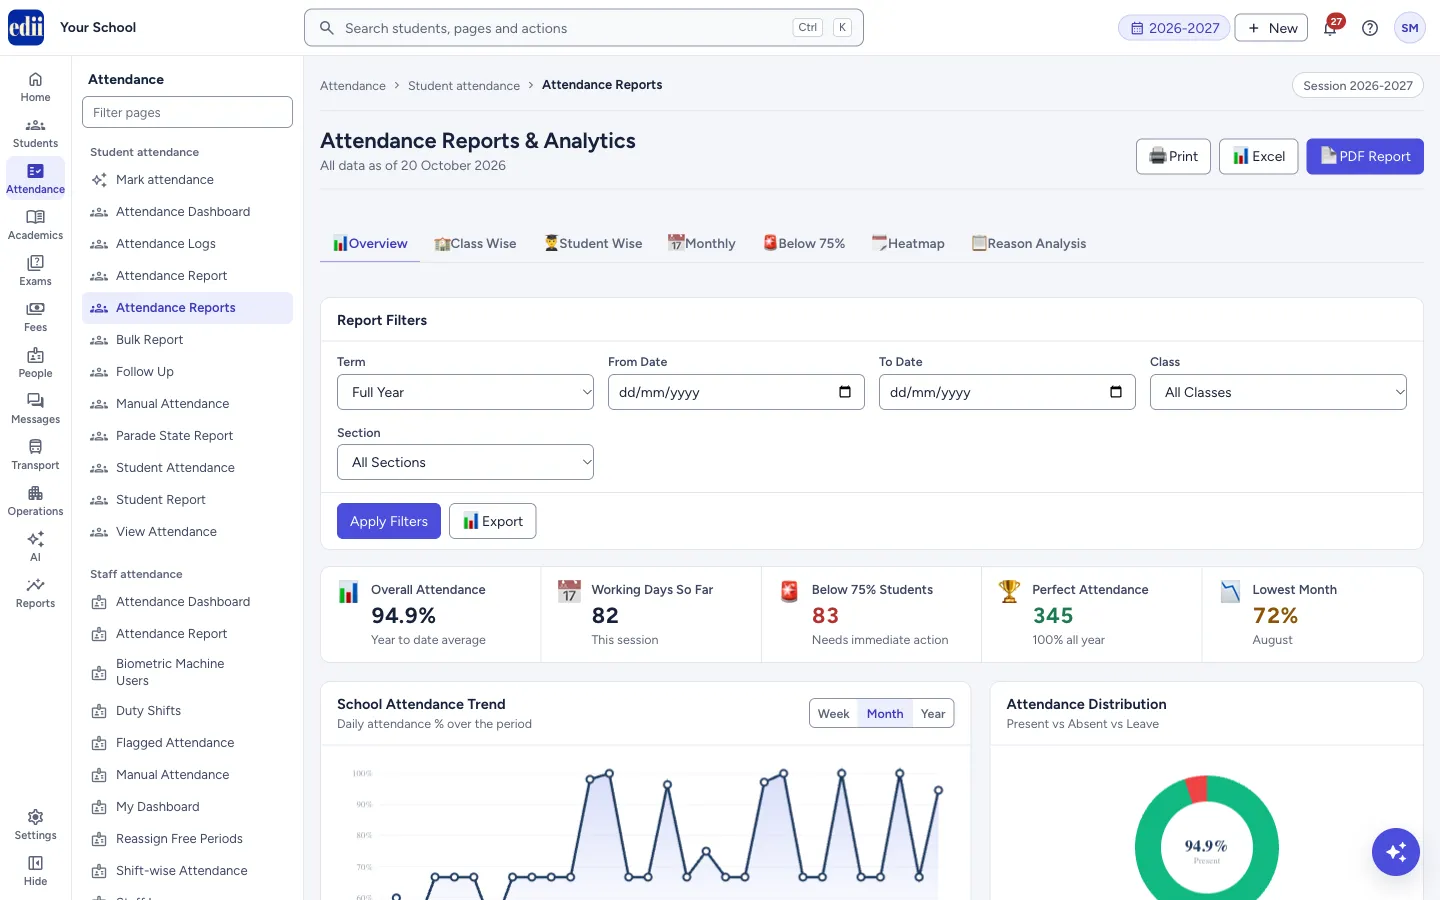
The screen is headed Attendance Reports & Analytics. It has seven tabs: Overview, Class Wise, Student Wise, Monthly, Below 75%, Heatmap and Reason Analysis. The Report Filters box above them applies to all tabs.
The page opens on Overview. A tab can also be opened from the Attendance Dashboard: its Below 75% Attendance chip opens the Below 75% tab and Open Reports → opens Class Wise.
At the top right, Print, Excel and PDF Report take what the open tab shows.
Who uses it and when
Section titled “Who uses it and when”The principal, the vice principal and the attendance in-charge, for the monthly review, board inspections and the 75 percent check.
Before you start
Section titled “Before you start”- Teachers must have marked attendance on Mark attendance. Reports for a tab are loaded from the saved attendance of the session shown at the top of the screen.
Where to find it
Section titled “Where to find it”- In school.edii.in: Attendance › Student attendance › Attendance Reports
- Or press Ctrl K (⌘ K on a Mac) and type Attendance Reports.
- Address:
school.edii.in/view/attendance-reports-new - Who can see it: Staff whose role includes Students or Attendance access. Shown only when your school uses Student in EDII. If it is missing from your menu, ask your school admin.
 Open a bigger pictureतस्वीर बड़ी करें
Step by step
Section titled “Step by step”1. Set the filters
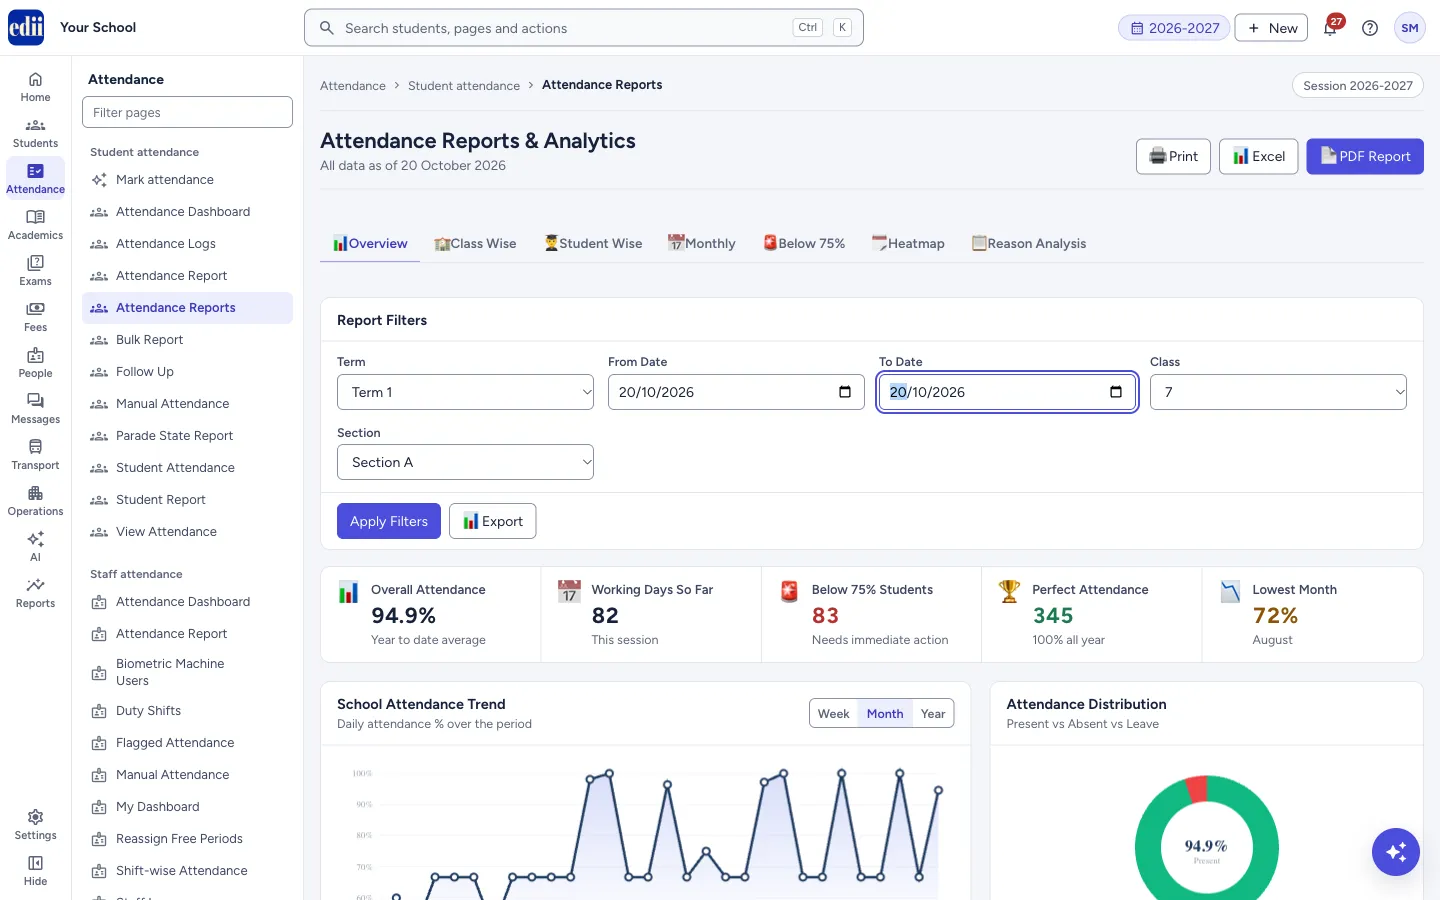
Section titled “1. Set the filters”In Report Filters, choose a Term (Full Year, Term 1 or Term 2), or pick a From Date and To Date, and optionally a Class (All Classes by default) and a Section (All Sections by default). Select Apply Filters to load the open tab again with your choices.
 Open a bigger pictureतस्वीर बड़ी करें
2. Overview
Section titled “2. Overview”Five boxes: Overall Attendance (year to date average), Working Days So Far, Below 75% Students, Perfect Attendance (100 percent all year) and Lowest Month. Below them are School Attendance Trend (choose Week, Month or Year), Attendance Distribution (Present, Absent and Leave as percentages), Month-wise Attendance, Day of Week Analysis and the Class-wise Summary table.
3. Class Wise
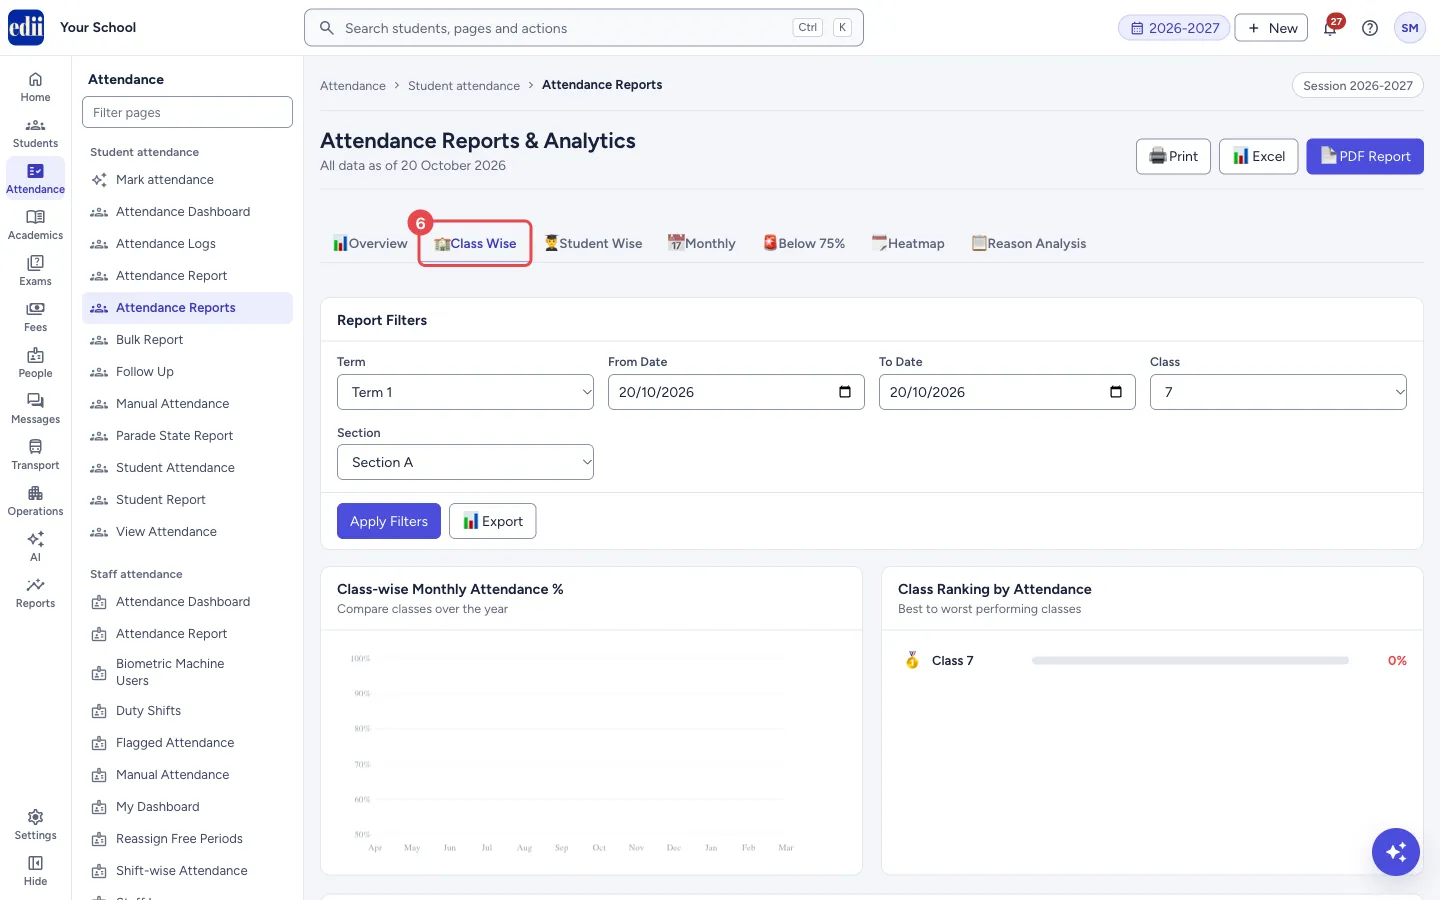
Section titled “3. Class Wise”Class-wise Monthly Attendance % compares classes month by month, Class Ranking by Attendance lists the classes from best to worst, and Detailed Class Report has one row per class with each month, YTD Avg and a Trend arrow.
 Open a bigger pictureतस्वीर बड़ी करें
4. Student Wise
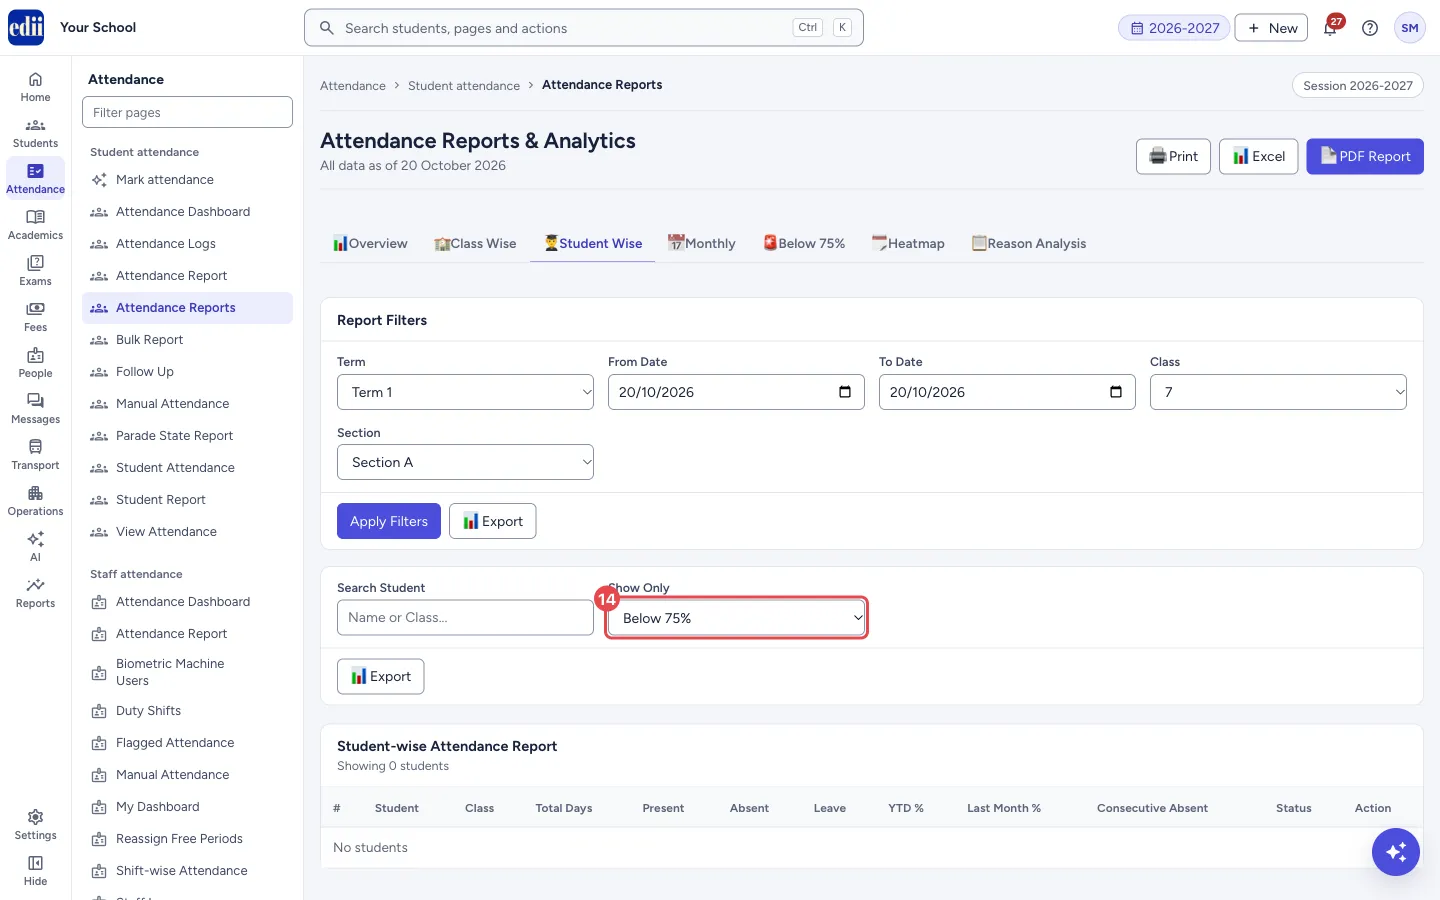
Section titled “4. Student Wise”A second filter row lets you type a name or class in Search Student and choose Show Only: All Students, Below 75%, Perfect Attendance or 3+ Consecutive Days (students absent three or more days in a row). The table Student-wise Attendance Report shows how many students are listed and one row for each.
 Open a bigger pictureतस्वीर बड़ी करें
5. Monthly
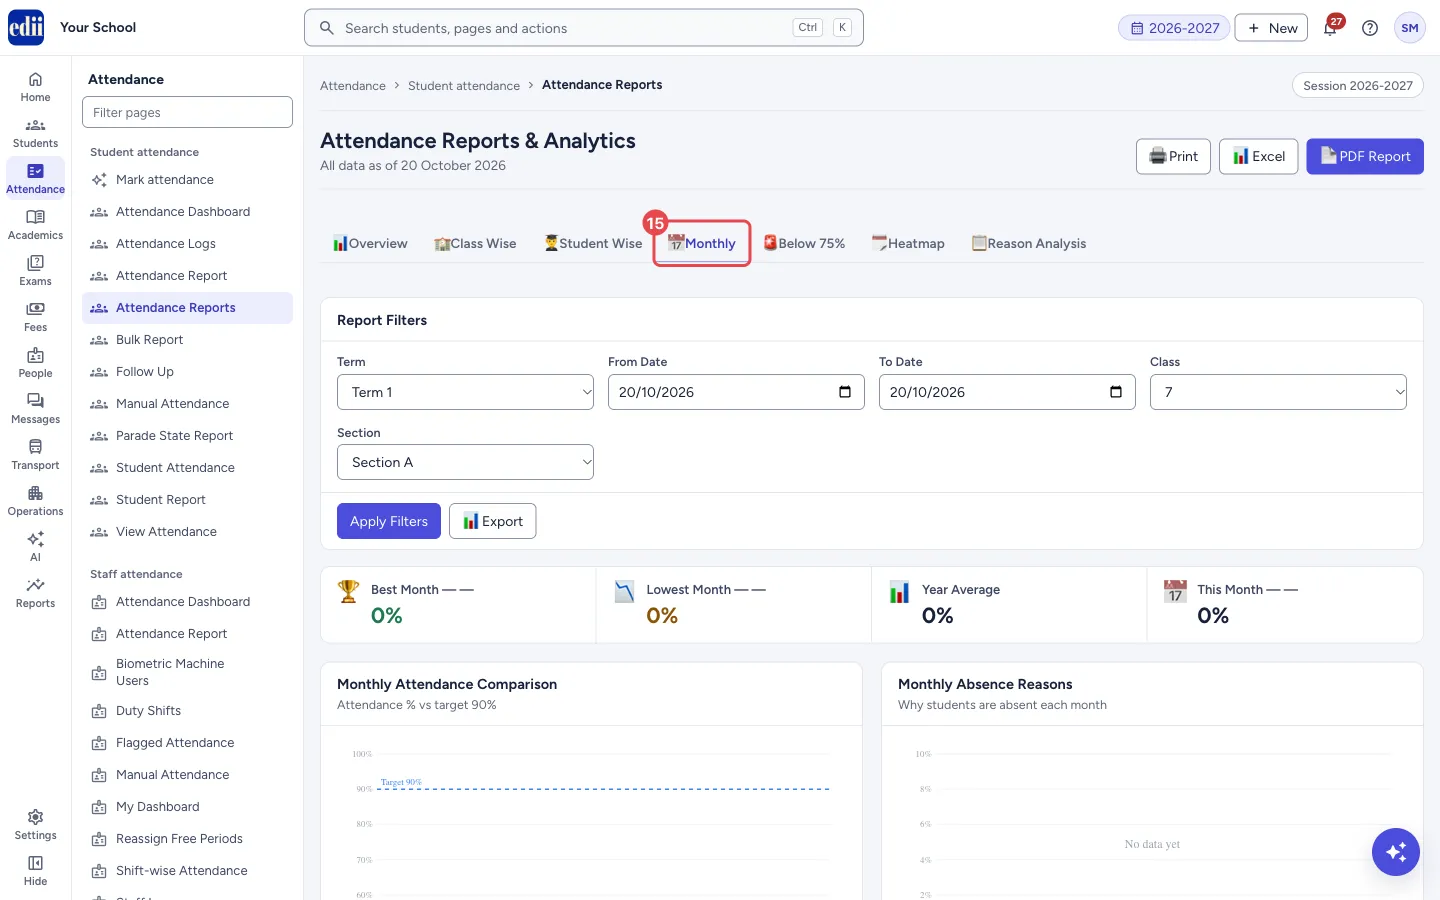
Section titled “5. Monthly”Four boxes name the Best Month, Lowest Month, Year Average and This Month. Monthly Attendance Comparison draws each month against a target of 90 percent, Monthly Absence Reasons shows why students were absent, and Month-wise Detailed Table has one row per month.
 Open a bigger pictureतस्वीर बड़ी करें
6. Below 75%
Section titled “6. Below 75%”Boxes count students Below 65% (Immediate action needed), 65% — 70%, 70% — 75% and Total At Risk. At-Risk Students by Class shows which classes have the most, Days Needed to Reach 75% shows how many more days students need, and Complete Below 75% Student List lists every student with present days, absent days, current percentage, days needed, category and how many times the family was contacted.
7. Heatmap and Reason Analysis
Section titled “7. Heatmap and Reason Analysis”Heatmap draws one row per month and one square per school day, darker green meaning better attendance; hover a square to see the date, the percentage and the number absent. Worst Attendance Days and Best Attendance Days list the top ten of each.
Reason Analysis uses the reasons recorded when a student is marked absent: Overall Reason Breakdown, Reasons by Class, Reasons Over Time and a summary table. It says No reasons recorded yet when none were recorded.
Fields and filters
Section titled “Fields and filters”| Field | What it is | Notes |
|---|---|---|
| Term | Limits the report to part of the session. | Full Year (all of the session), Term 1 (1 April to 30 September of the session’s first year) or Term 2 (1 October to 31 March). Dates you pick in From Date and To Date are used instead of the term. |
| From Date, To Date | A date range for the report. | Optional. |
| Class, Section | Limit the report to one class and one section. | Optional. All classes and sections by default. |
| Search Student, Show Only | Filter the Student Wise list on the screen. | Only on the Student Wise tab. |
Buttons
Section titled “Buttons”| Button | What it does | What happens next |
|---|---|---|
| Apply Filters | Loads the open tab again using the filters. | The tab is refreshed. |
| Export (in filters, and in each table) | Downloads the open tab’s table as a CSV file named like attendance-overview-20261020. | Shows Nothing to export for this view when there is nothing. |
| Excel | Same as Export, from the top of the page. | |
| PDF Report | Saves the table of the open tab as a landscape PDF with the academic year and the date. | The Heatmap tab has no table in the PDF. |
| Opens your browser’s print window for the page. |
Columns
Section titled “Columns”| Column | Meaning |
|---|---|
| Class-wise Summary: Class, Total Students, Avg Attendance % | The class, its students and its average attendance for the session so far. |
| Best Month, Worst Month | The months with the highest and the lowest attendance of that class. |
| Below 75%, Perfect | Students of the class below 75 percent, and with 100 percent attendance. |
| Trend, Status | A trend arrow and a status word for the class. |
| Student Wise: Total Days, Present, Absent, Leave | Days marked for the student, and how many of each. |
| YTD %, Last Month % | Attendance for the session so far, and for last month. |
| Consecutive Absent | Days in a row the student is absent (shown as 3d). |
| Status | A status word for the student’s attendance, such as Good, Average, Warning or Critical. |
| Below 75%: Days Needed, Category, Contacted | Days of attendance the student needs to reach 75 percent, the group (Critical, Warning or Border) and the number of times the family was contacted (for example 2x). |
Good to know
Section titled “Good to know”- The Report Filters box always shows, on every tab, and its dates and class change what the tab loads.
- Students are counted as Critical below 65 percent, Warning from 65 to 70 percent and Border from 70 to 75 percent.
Messages you may see
Section titled “Messages you may see”| Message | What it means | What to do |
|---|---|---|
| Could not load report | The data for the tab could not be loaded. | Check the internet connection and select Apply Filters. |
| Nothing to export for this view | The open tab has no table rows. | Change the filters or the tab. |
| PDF export not available in this build | The PDF could not be created. | Use Excel or Print instead. |
- Use Below 75% every month to find students who need a notice, then contact the families from Follow Up.
- A date range with only one day, such as today, shows almost nothing in the charts. Use a term or a month.
Stuck? Try this
Section titled “Stuck? Try this”| Problem | Likely cause | What to do |
|---|---|---|
| Charts and tables are empty or show 0 percent. | No attendance was marked in the term or the dates you chose, or the class and section have no students. | Widen the dates, choose Full Year, or clear the class and section. |
Did this page help?क्या इस पेज से मदद मिली?
Thanks! Glad it helped.धन्यवाद! अच्छा लगा कि काम बन गया।
Sorry about that. Ask in your own words, or write to us.माफ़ कीजिए। अपने शब्दों में पूछें, या हमें लिखें।