
Screen guide · Web app
Dropout Prediction
An early-warning list that gives each student a dropout risk score from attendance, marks, fees and school records, with suggested actions for staff to follow up.
यह पेज अंग्रेज़ी में है। कुछ समझ न आए तो ।
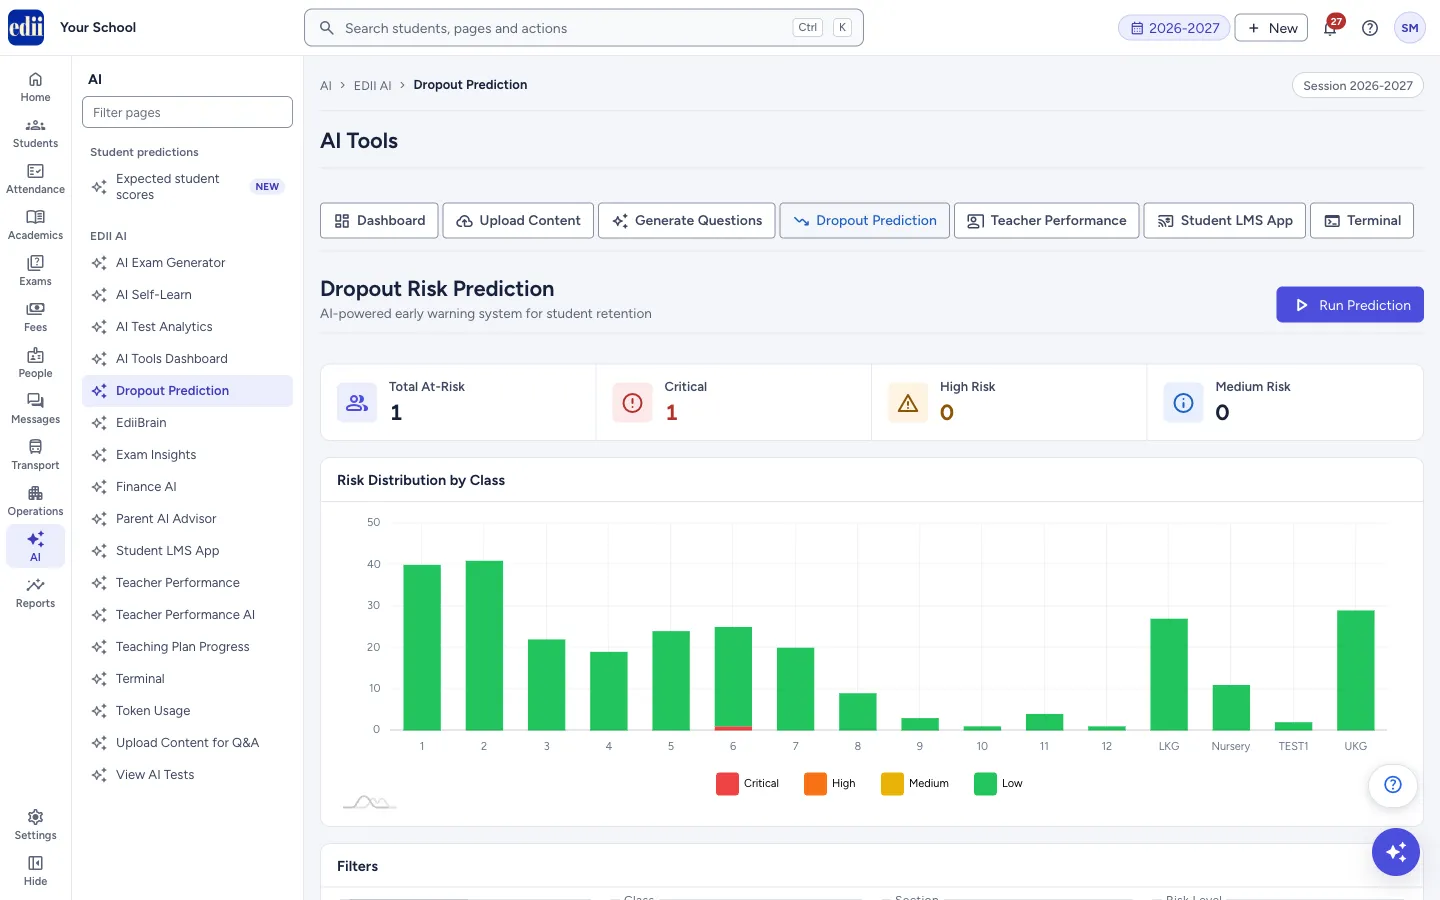
Dropout Prediction (headed Dropout Risk Prediction) lists the school’s students by a risk score, highest first. The score is a percentage worked out by AI from the student’s attendance, academic results, fee payments and other school records. A student is marked Critical, High, Medium or Low.
At the top, Total At-Risk, Critical, High Risk and Medium Risk show how many students are in each group, and a chart Risk Distribution by Class shows the groups class by class. Below are the Filters and the Student predictions table.
The score is an estimate, not a fact. A high score does not mean a student will leave, and a low one does not mean they will stay. Use the list to decide whom to speak to first, and check each case yourself.
Who uses it and when
Section titled “Who uses it and when”The principal, class teachers and counsellors use it to find students who may need attention before they leave the school.
Before you start
Section titled “Before you start”- Predictions are made when someone selects Run Prediction. If none has been run, the table says No predictions available and Click “Run Prediction” to analyze student dropout risk.
- The result is only as good as the records: attendance, marks and fees should be up to date.
Where to find it
Section titled “Where to find it”- In school.edii.in: AI › EDII AI › Dropout Prediction
- Or press Ctrl K (⌘ K on a Mac) and type Dropout Prediction.
- Address:
school.edii.in/ai-tools/dropout-prediction - Who can see it: Shown only when your school uses EDII’s AI in EDII. If it is missing from your menu, ask your school admin.
 Open a bigger pictureतस्वीर बड़ी करें
Step by step
Section titled “Step by step”1. Run a fresh prediction
Section titled “1. Run a fresh prediction”Select Run Prediction to work out the scores again for all students. The button shows Running… while it works. When it finishes you see Prediction complete: N students analyzed and the counts, chart and table are refreshed.
At the very bottom, Last prediction shows when it was last run, with a version code.
2. Narrow the list with filters
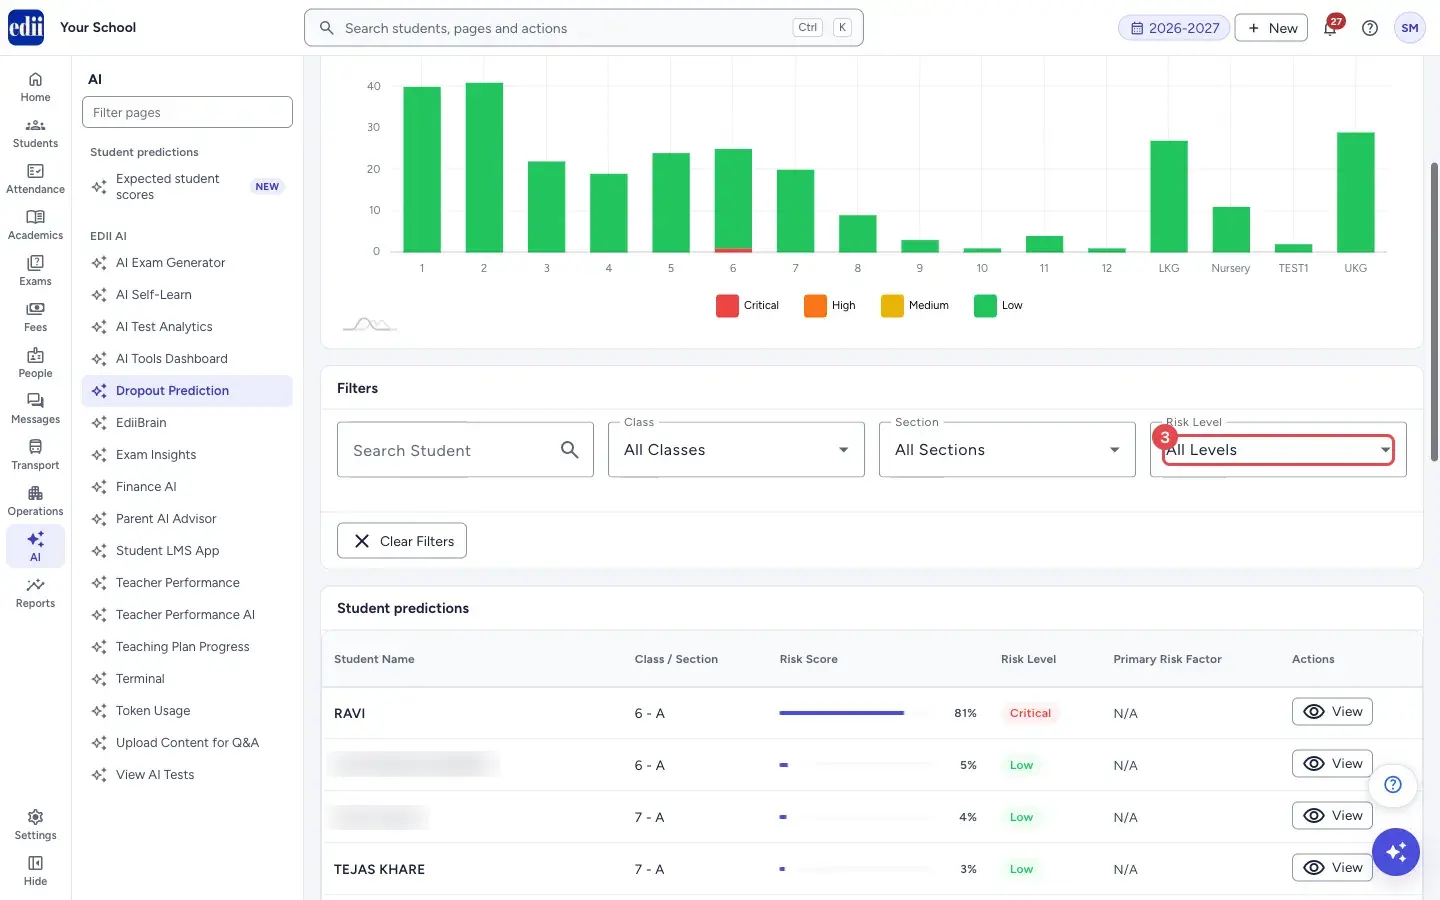
Section titled “2. Narrow the list with filters”Type in Search Student to find a name (the list updates after a short pause). Open Class, then Section, then Risk Level (Critical, High, Medium or Low). Choosing a class clears the section. Clear Filters removes every filter.
 Open a bigger pictureतस्वीर बड़ी करें
3. Read the table
Section titled “3. Read the table”Each row shows the student’s name, class and section, a Risk Score bar with its percentage, a coloured Risk Level and the Primary Risk Factor (the first risk factor found, or N/A if none). Rows are in order of risk score, highest first.
The table shows 10, 25 or 50 students per page; use the arrows at the bottom to move through the pages.
4. Open a student’s details
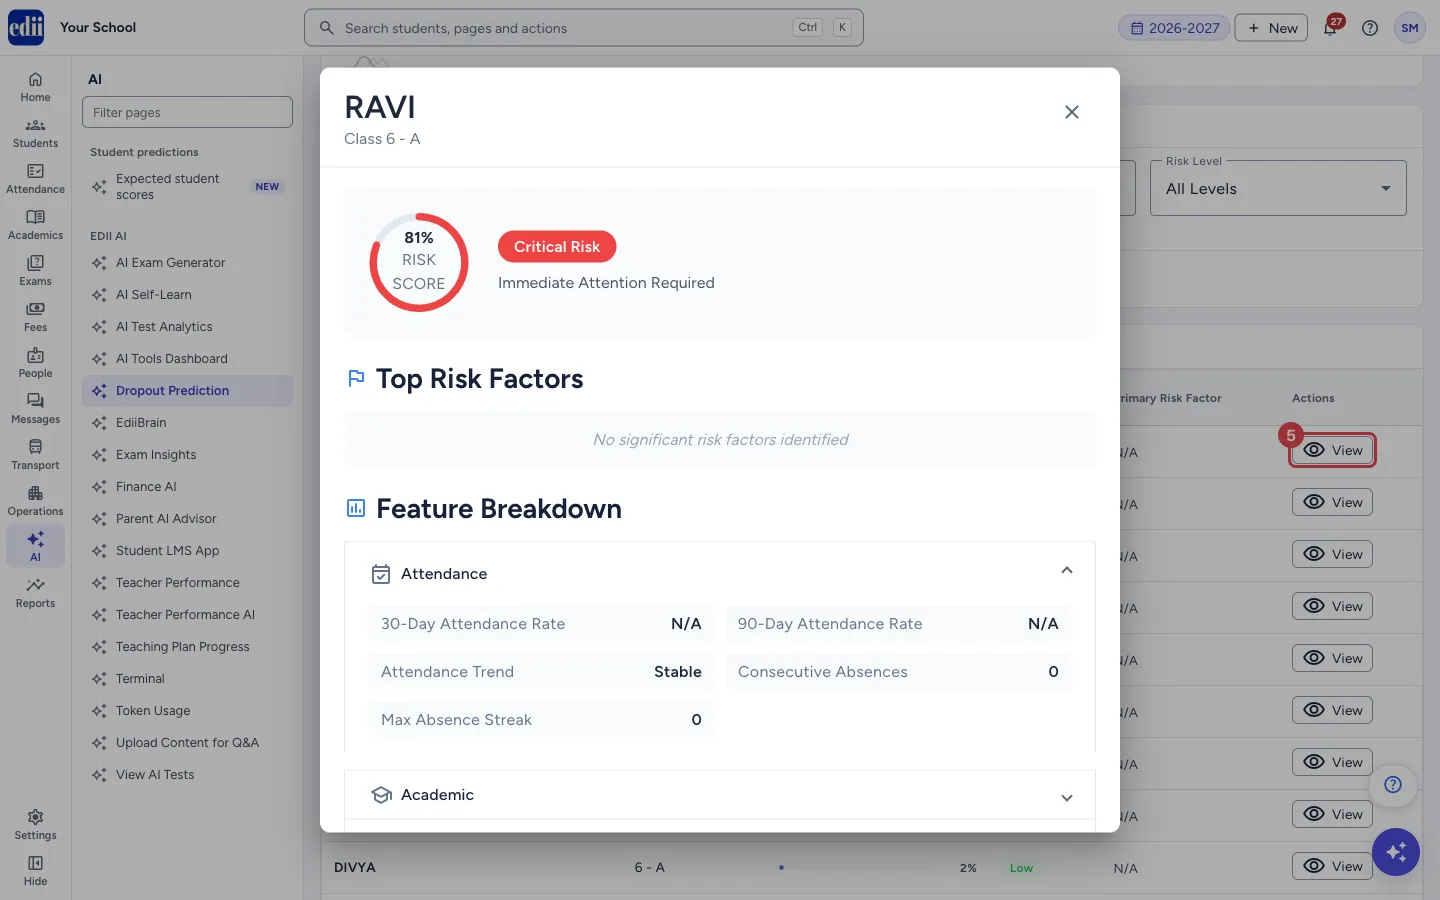
Section titled “4. Open a student’s details”Select View (or anywhere on the row). A window opens with the student’s name and class, a round gauge with the Risk Score, the risk level and a short note such as Immediate Attention Required.
 Open a bigger pictureतस्वीर बड़ी करें
5. Read the reasons
Section titled “5. Read the reasons”Top Risk Factors lists what raised the score, each with a severity and a sentence of explanation. If nothing stands out it says No significant risk factors identified.
Feature Breakdown has four sections that you can open: Attendance (30-day and 90-day attendance rate, trend, consecutive absences, longest absence streak), Academic (average score, trend, failed subjects, tests missed, lowest subject score), Financial (pending amount, pending months, days since last payment, payment consistency) and Behavioral (suspensions, TC issued, disability, special category).
6. Follow up on the suggested actions
Section titled “6. Follow up on the suggested actions”If the student has Recommended Interventions, each shows a priority, a title, a description and a status. Select Assign to mark it as taken up (status Assigned). When it is done select Mark Complete. After that, record how it went with Effective, Partial or Ineffective. The window then shows the outcome. A message Intervention updated confirms each change.
Fields and filters
Section titled “Fields and filters”| Field | What it is | Notes |
|---|---|---|
| Search Student | Finds students by name. | Optional. |
| Class, Section | Limits the list to one class or section. | The class list comes from the classes that have predictions. |
| Risk Level | Limits the list to one risk group. | Critical, High, Medium or Low. |
Buttons
Section titled “Buttons”| Button | What it does | What happens next |
|---|---|---|
| Run Prediction | Works out the risk scores again for all students. | Prediction complete: N students analyzed; the page refreshes. |
| Clear Filters | Removes the search, class, section and risk level filters. | All students show again. |
| View | Opens the student’s risk details. | A window opens. |
| Assign / Mark Complete / Effective / Partial / Ineffective | Tracks a suggested action for the student. | Intervention updated. |
Columns
Section titled “Columns”| Column | Meaning |
|---|---|
| Student Name | The student’s name. |
| Class / Section | The student’s class and section. |
| Risk Score | The estimated risk as a percentage, with a bar. |
| Risk Level | Critical, High, Medium or Low. |
| Primary Risk Factor | The main reason found for the risk. N/A means no risk factor was recorded. |
Good to know
Section titled “Good to know”- The scores are AI estimates. Staff should look at each student before acting on a score.
- Details in the student window are worked out from the student’s attendance, marks and fee records at the time you open it.
- Changing an action’s status here is saved against the student, and the table refreshes when you close the window.
Messages you may see
Section titled “Messages you may see”| Message | What it means | What to do |
|---|---|---|
| No predictions available | No prediction has been run, or nothing matches the filters. | Select Run Prediction, or Clear Filters. |
| Failed to run prediction | The prediction could not be completed. | Try again after a moment. |
| Failed to load predictions | The table could not be loaded. | Reload the page. |
| Failed to load summary | The counts could not be loaded. | Reload the page. |
| Failed to load student details | The student’s window could not be filled. | Close it and select View again. |
| No significant risk factors identified | No single factor stood out for the student. | Nothing to do. |
- Start with Critical and High, then talk to the class teacher before contacting parents.
- Run the prediction again after attendance and fees have been updated, so that the list is current.
Stuck? Try this
Section titled “Stuck? Try this”| Problem | Likely cause | What to do |
|---|---|---|
| Most students show 1% to 5% and N/A as the factor. | The records show nothing that raises their risk. | This is normal. Look at the Critical and High rows first. |
Did this page help?क्या इस पेज से मदद मिली?
Thanks! Glad it helped.धन्यवाद! अच्छा लगा कि काम बन गया।
Sorry about that. Ask in your own words, or write to us.माफ़ कीजिए। अपने शब्दों में पूछें, या हमें लिखें।