
Screen guide · Web app
Financial Analytics Dashboard
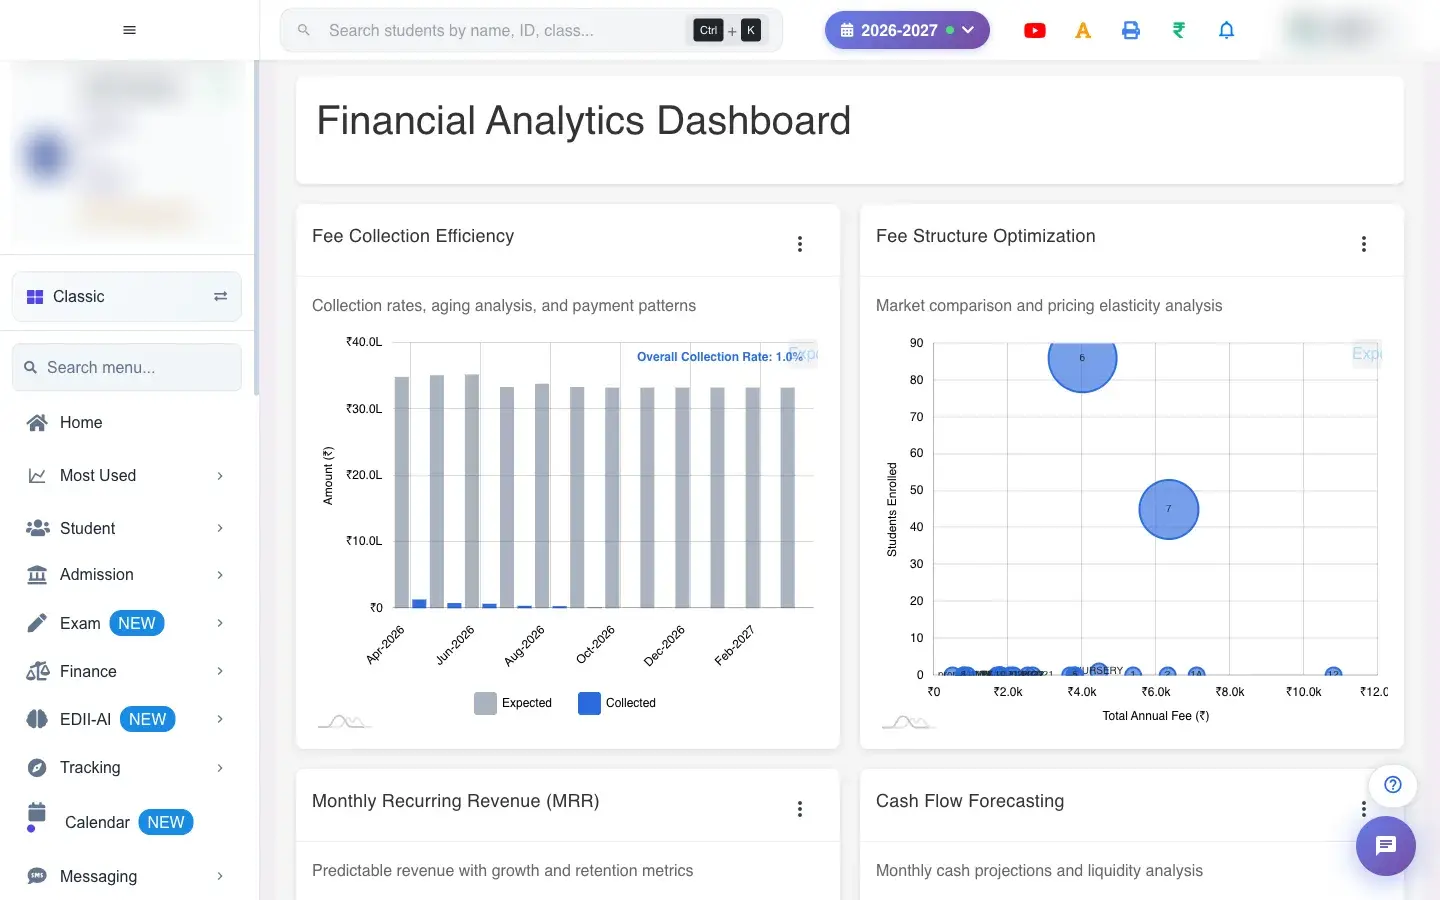
A financial analytics dashboard comparing your school's fee collection with other schools in your region: collection efficiency, trends, payment modes and ranking.
यह पेज अंग्रेज़ी में है। कुछ समझ न आए तो ।
Financial Analytics Dashboard (EDII-AI › School Finance) shows How Your School Compares. The Performance Benchmarking section compares your financial performance with other institutions in your region (Total Fees Comparison, Total Collection Comparison, Collection Efficiency Comparison), then Key Financial Metrics: Total Fees Collection, Monthly Fees Collection Trend, Average Monthly Collection, Late vs On-Time Fees Collection, Online vs Offline Collection and Payment Mode Distribution. Further down are the Performance Comparison (Top 5 Schools), Your Collection Efficiency, School Size vs Collection Efficiency, Collection Growth Trend and Your Performance Ranking.
Quick Actions include Show Problem Areas, Year-over-Year Comparison and Executive Summary. Refresh Data reloads (Last updated) and Export downloads.
Who uses it and when
Section titled “Who uses it and when”The principal, trustees and accountant use it for fee strategy.
Before you start
Section titled “Before you start”- Fee collection must be recorded in EDII.
Where to find it
Section titled “Where to find it”- Menu: EDII-AI › School Finance
- Address:
/view/finance-analytics-v1 - If it is missing from your menu, your role does not include it. Ask your school admin.
 Open a bigger pictureतस्वीर बड़ी करें
Buttons
Section titled “Buttons”| Button | What it does | What happens next |
|---|---|---|
| Refresh Data | Reloads the figures. | Updates Last updated. |
| Show Problem Areas | Highlights weak areas. | Only the view changes. |
| Year-over-Year Comparison | Compares with last year. | Only the view changes. |
| Executive Summary | Shows a short summary. | Only the view changes. |
| Export | Downloads the dashboard. | Saves a file. |
After you save
Section titled “After you save”- This screen only reads data.
Good to know
Section titled “Good to know”- Comparisons use anonymised figures from other schools; no school is named.
Messages you may see
Section titled “Messages you may see”| Message | What it means | What to do |
|---|---|---|
| Try Again | The dashboard failed to load. | Press Try Again. |
- Look at collection efficiency first: it shows how much of what is billed is actually collected.
Stuck? Try this
Section titled “Stuck? Try this”| Problem | Likely cause | What to do |
|---|---|---|
| No comparison data | Too little data this session. | Check again after more collections. |
Did this page help?क्या इस पेज से मदद मिली?
Thanks! Glad it helped.धन्यवाद! अच्छा लगा कि काम बन गया।
Sorry about that. Ask in your own words, or write to us.माफ़ कीजिए। अपने शब्दों में पूछें, या हमें लिखें।