Skip to content
This guide is about the older EDII web app. Using school.edii.in? Open the school.edii.in help.
Help homeहेल्प होम

How-to · Web app

Attendance reports

हाज़िरी रिपोर्ट

Read attendance trends and reports.

1 step1 स्टेप

यह पेज अंग्रेज़ी में है। कुछ समझ न आए तो ।

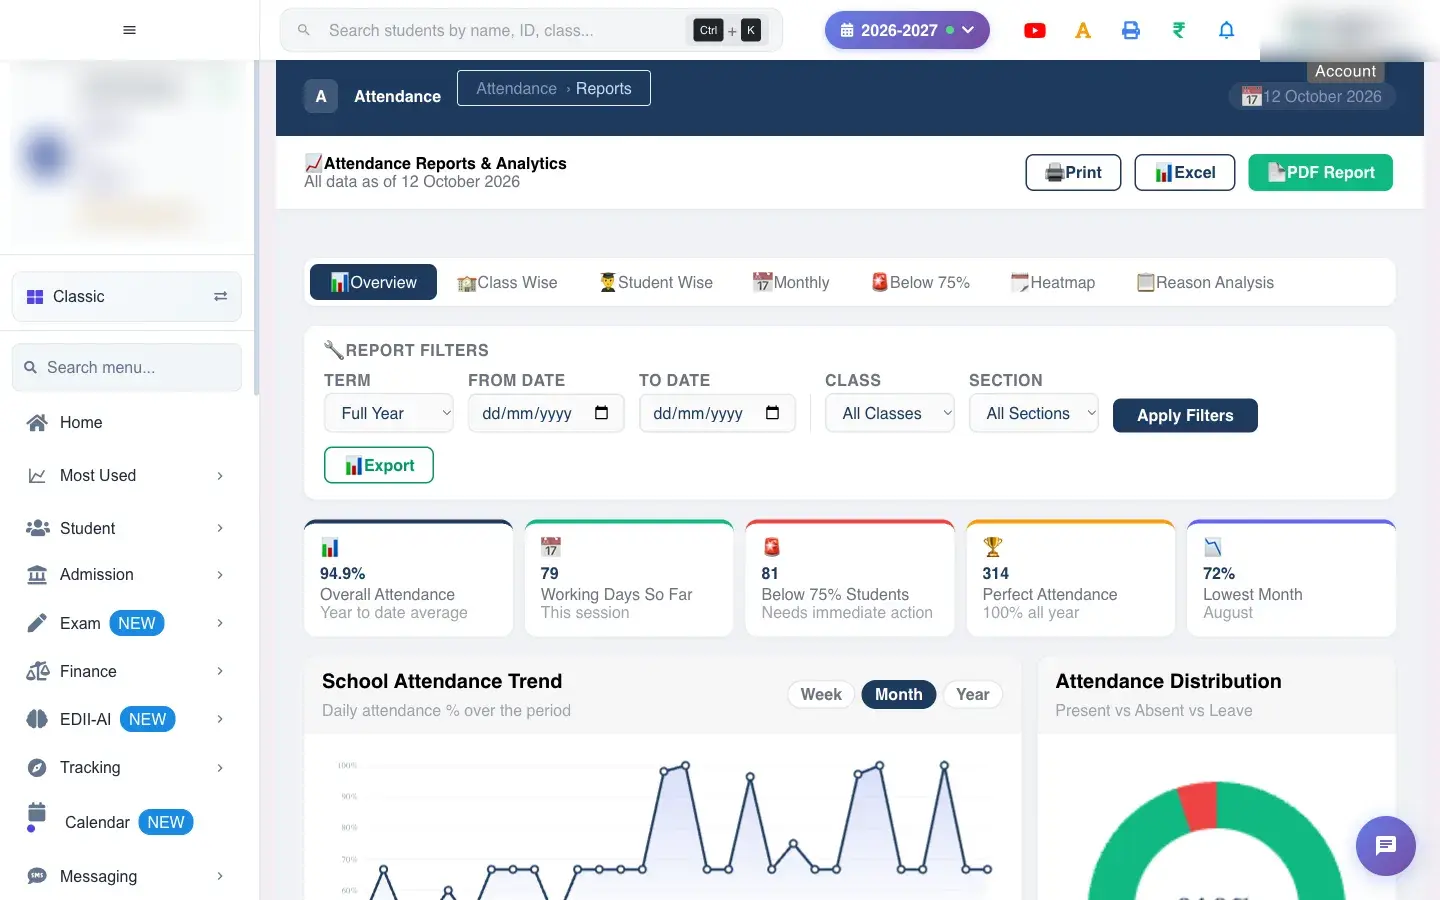
Attendance Reports & Analytics turns the year’s saved attendance into seven views, one for each tab across the top: Overview, Class Wise, Student Wise, Monthly, Below 75%, Heatmap and Reason Analysis.

  • Attendance must be marked during the period for the charts to have anything to show; empty views say No data.
  • Set the filters first and press Apply Filters; the tabs then show the same period.
  1. Open the screen from the menu.

    Open the screenOpen a bigger pictureतस्वीर बड़ी करें
    Full details of this screen Attendance reports
  • Terms are fixed: Term 1 is 1 April to 30 September; Term 2 is 1 October to 31 March.
  • A custom From and To date overrides the term.
  • The 75% line is the school’s attendance threshold used across the attendance screens.
You see Why What to do
Views show No data No attendance was saved in the chosen period. Change the term or the dates.

Did this page help?क्या इस पेज से मदद मिली?

Ask EDIIEDII से पूछें

Ask in English, Hindi or Hinglish. Answers come only from these help pages.English, हिंदी या Hinglish में पूछें। जवाब सिर्फ़ इन्हीं हेल्प पेजों से आते हैं।

Try askingऐसे पूछकर देखें