
Screen guide · Web app
School Exam Performance Analytics
School exam performance analytics: over twenty graphs on averages, pass rates, classes, subjects, trends, top performers and more, with filters and PDF or Excel export.
यह पेज अंग्रेज़ी में है। कुछ समझ न आए तो ।
School Exam Performance Analytics (EDII-AI › School Exam) turns exam results into graphs. Headline cards show Overall Average (marks obtained vs possible), Pass Rate (papers scoring 33% or above), Students Assessed (of those on roll with marks recorded) and Total Exams.
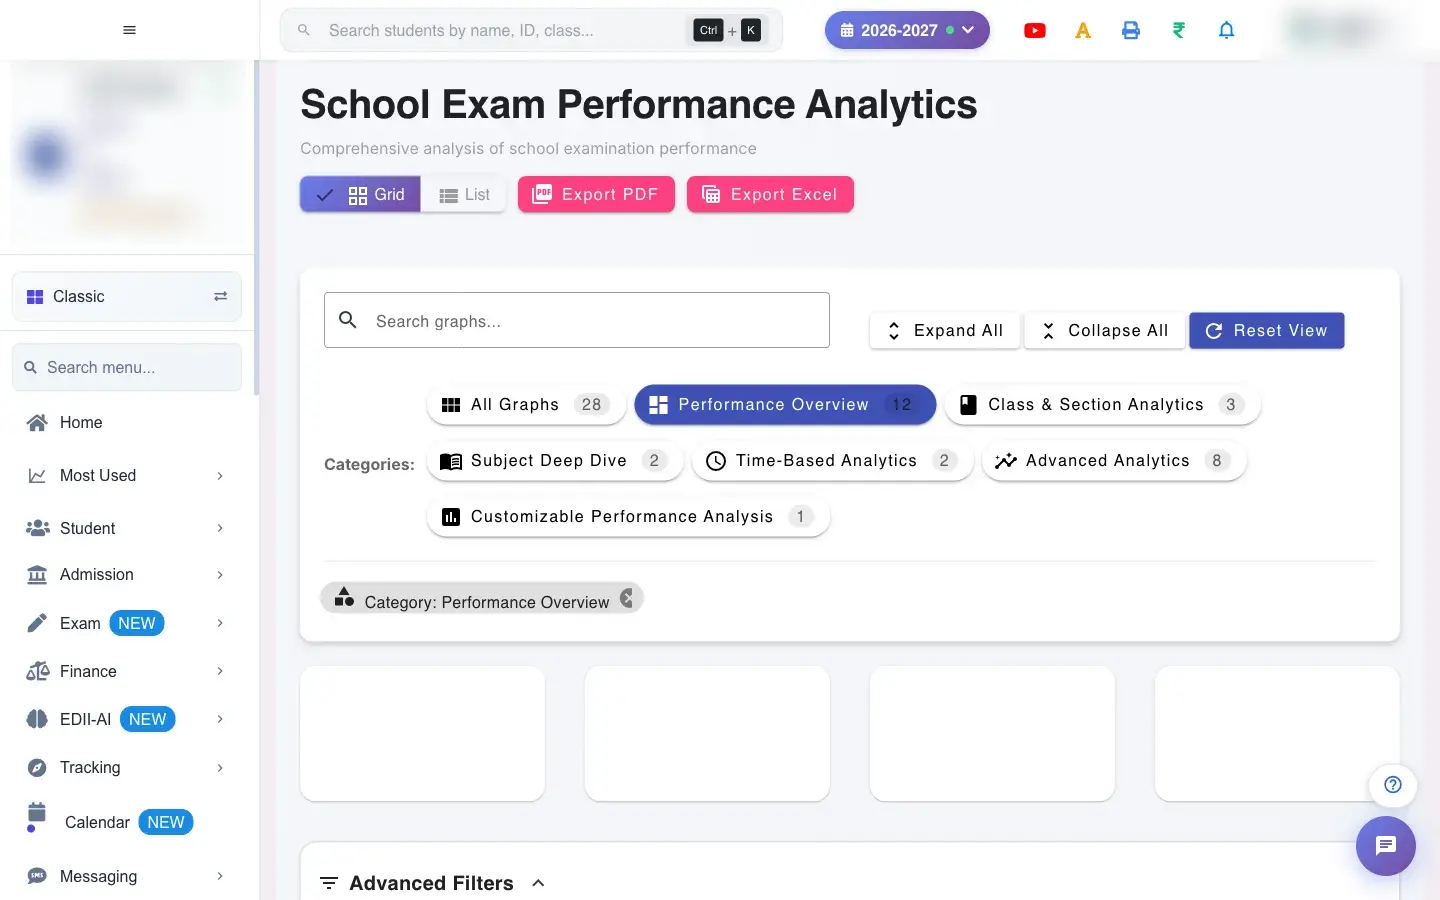
The graphs are grouped into categories: Performance Overview, Class & Section Analytics, Subject Deep Dive, Time-Based Analytics, Advanced Analytics (score and grade distributions, percentile ranking, variance, heatmap, predictive views) and Customizable Performance Analysis. Filters for class, section, subject, exam and year narrow everything; Search graphs… finds one. Use Grid or List, Expand All / Collapse All, Reset View, and Export PDF or Export Excel.
Who uses it and when
Section titled “Who uses it and when”The principal and exam in-charge use it for result reviews and planning.
Before you start
Section titled “Before you start”- Marks must be entered for the exams you want to analyse.
Where to find it
Section titled “Where to find it”- Menu: EDII-AI › School Exam
- Address:
/view/exam-ai - If it is missing from your menu, your role does not include it. Ask your school admin.
 Open a bigger pictureतस्वीर बड़ी करें
Step by step
Section titled “Step by step”1. Choose filters
Section titled “1. Choose filters”Pick All Classes, All Sections, All Subjects, All Exams and the year, then select Apply (Reset clears them).
2. Browse by category
Section titled “2. Browse by category”Use the category chips (All Graphs, Performance Overview, Class & Section Analytics, Subject Deep Dive, Time-Based Analytics, Advanced Analytics, Customizable Performance Analysis) to filter the graphs.
3. Customizable analysis
Section titled “3. Customizable analysis”Choose an analysis such as Top & Bottom with a count (for example 5), exam, subject, class and section and select Analyze Performance. View the result as a Table View (Student Name, Class, Section, Subject, Exam, Score, Percentage) or Chart View.
4. Export
Section titled “4. Export”Export PDF and Export Excel save what is on screen.
With data
Section titled “With data”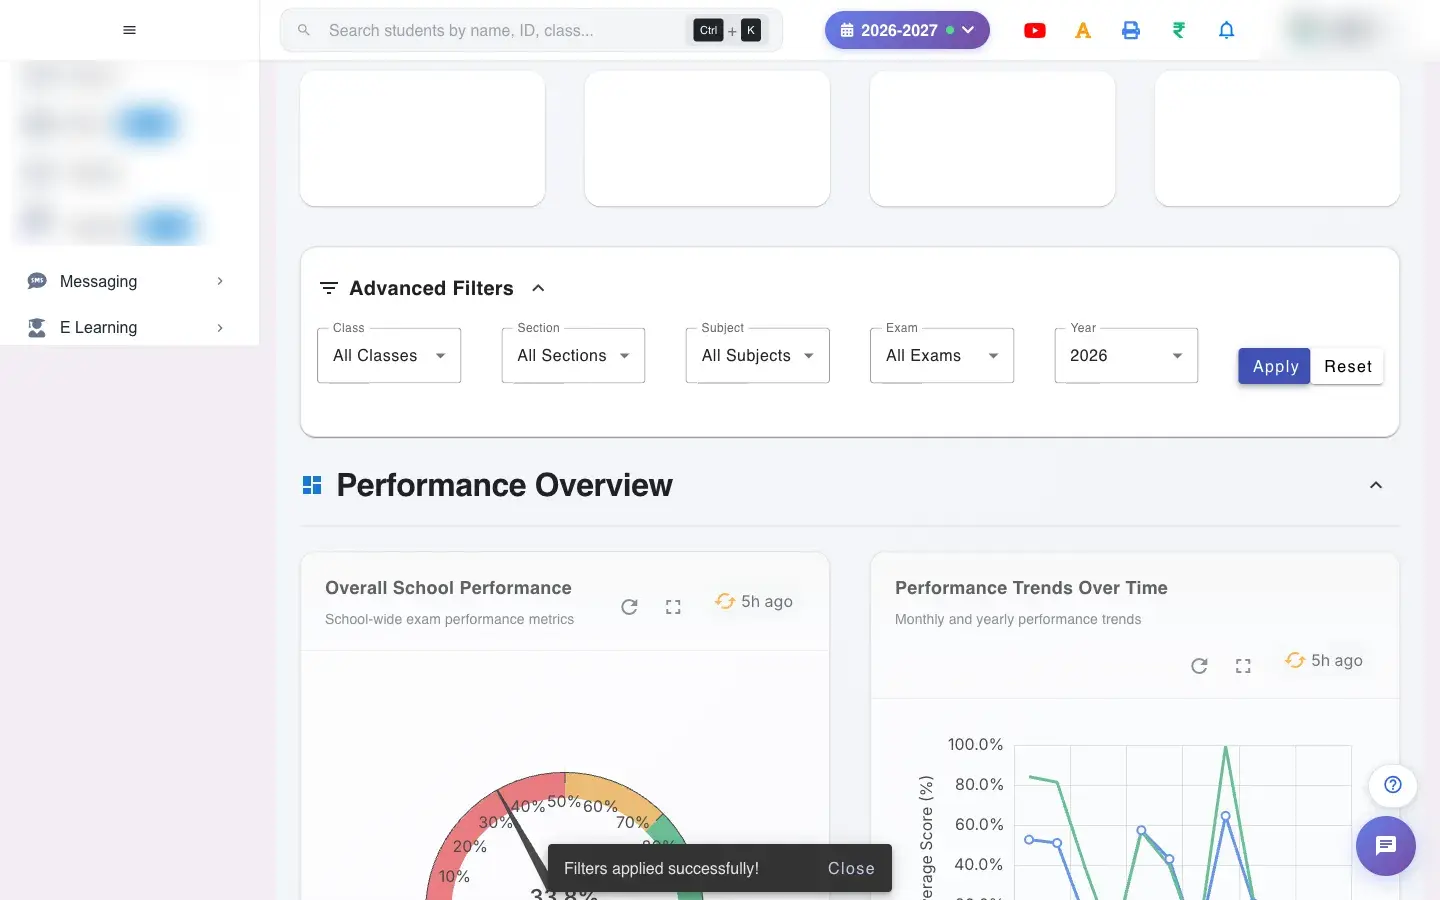 Open a bigger pictureतस्वीर बड़ी करें
Fields and filters
Section titled “Fields and filters”| Field | What it is | Notes |
|---|---|---|
| Class / Section / Subject / Exam / Year | Filters. | Default all. |
| Search graphs… | Find a graph. | Only filters. |
| Analysis type and count | For the customizable view. | For example Top & Bottom, 5. |
Buttons
Section titled “Buttons”| Button | What it does | What happens next |
|---|---|---|
| Apply / Reset | Applies or clears filters. | Graphs reload. |
| Analyze Performance | Runs the customizable analysis. | Shows a table or chart. |
| Export PDF / Export Excel | Saves the analytics. | Downloads a file. |
Columns
Section titled “Columns”| Column | Meaning |
|---|---|
| Student Name / Class / Section / Subject / Exam / Score / Percentage | Rows of the customizable table view. |
After you save
Section titled “After you save”- This screen only reads data. Nothing is saved or sent.
Good to know
Section titled “Good to know”- Pass rate counts papers scoring 33% or above.
Messages you may see
Section titled “Messages you may see”| Message | What it means | What to do |
|---|---|---|
| Network Issue, Please Try Again. | A graph could not load. | Try again. |
- Start with Performance Overview, then drill into a class or subject.
- Export to PDF for the principal’s meeting.
Stuck? Try this
Section titled “Stuck? Try this”| Problem | Likely cause | What to do |
|---|---|---|
| Graphs are empty | No marks for the filters. | Widen the filters. |
Did this page help?क्या इस पेज से मदद मिली?
Thanks! Glad it helped.धन्यवाद! अच्छा लगा कि काम बन गया।
Sorry about that. Ask in your own words, or write to us.माफ़ कीजिए। अपने शब्दों में पूछें, या हमें लिखें।